
Markov Chains
Markov Processes, also called Markov Chains are described as a series of “states” which transition from one to another, and have a given probability for each transition. They are used as a statistical model to represent and predict real world events. Below is a representation of a Markov Chain with two states.
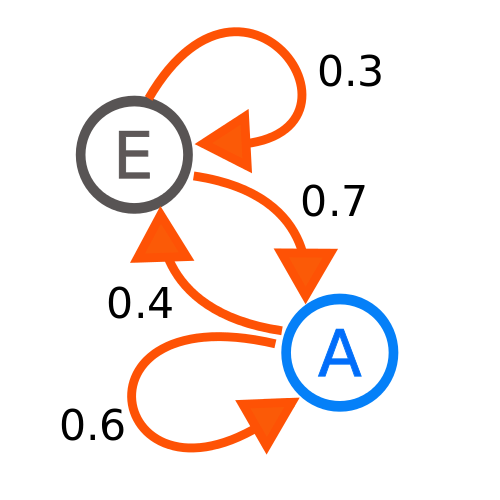
If the initial state is state E, there is a 0.3 probability that the current state will remain at E after one step. There is also an arrow from E to A (E -> A) and the probability that this transition will occur in one step. If we start at state A we have a 0.4 probability of transitioning to position 0.4 and a 0.6 probability of maintaining state A after one step.
Discrete-Time Markov Chains
The example above refers to a discrete-time Markov Chain, with a finite number of states. This means that there are only so many “events” or “states” which are represented or representable by the chain. The discreetness of time refers to the idea that time is not directly taken into consideration. This means there are no partial states nor transitions from one state to another, outside of the serial/linearly dependent states. There are several other versions of Markov Chains, yet the most useful (in the sense that it is the basis of all the others) is the standard discrete-time Markov Chain.
Tools of the Chain – Generating Markov Processes
Using a Markov Process is relatively straight forward, you require a time/step dependent problem with statistical probabilities between each step and then a given time/step interval. That’s it! For example,
A pizza delivery boy is attempting to deliver a pizza five blocks to a house. Every block he has a 50% chance of moving to the next block, he gets stuck in traffic with the probability of his current block (i.e. 1/10 for block 1, 2/10 for block 2, etc.) and the remaining probability that he losses his way and goes back a block (this is one stupid delivery boy). What is the probability that in ten steps** he will deliver the pizza?
** In this example a “step” is how long it takes to travel from one block (state) to the next.
The first step to developing our chain, is to develop a probability matrix, representing the probabilities from going to one state to the next. This is often made easier by first drawing out all of the different states (similar to the image above) and the probabilities from one to the next, as so:
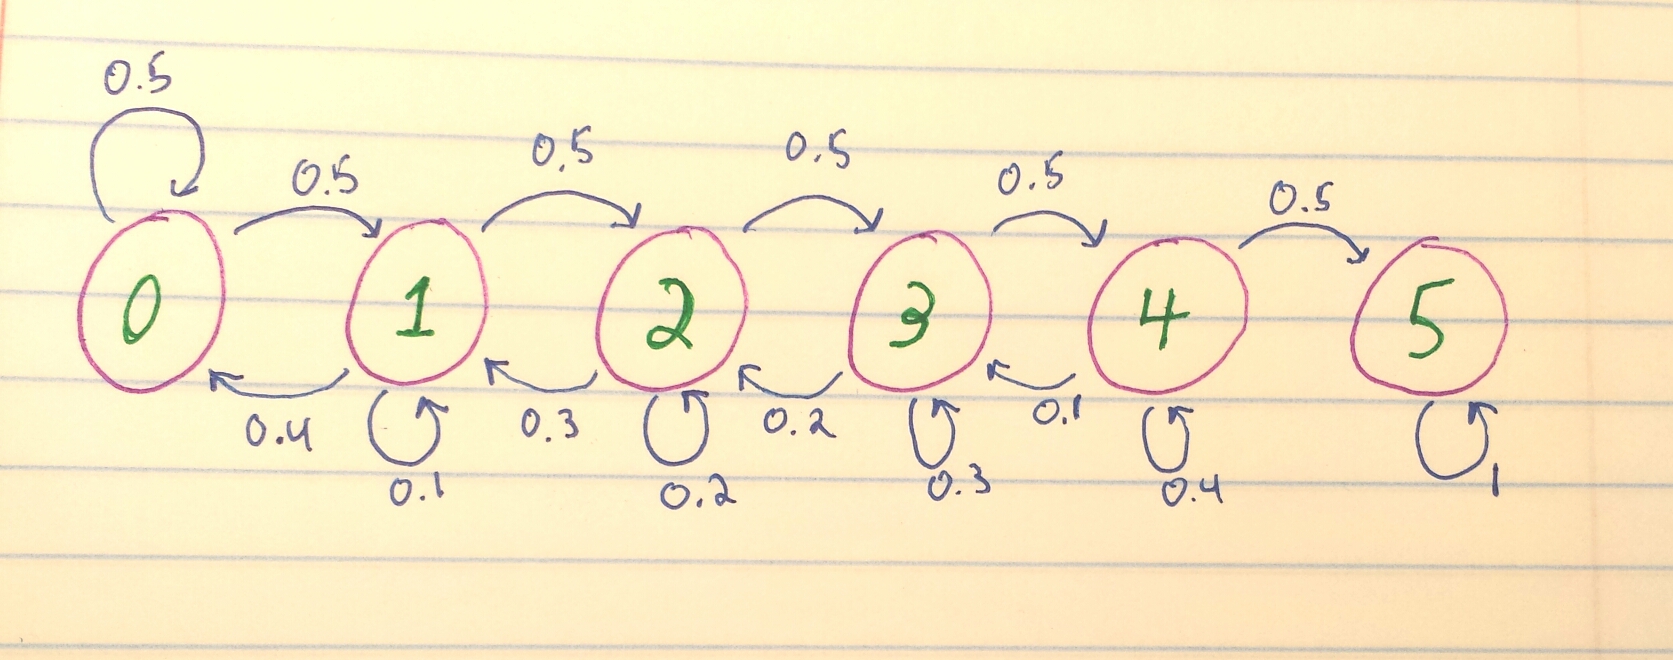
From the example problem we have 0 – our initial block and 1 – 5 the five remaining blocks. Further, we have the probabilities, drawn as arrows) from one state to the next, as well as the probabilities of staying at a particular block. At the fifth block, since he is at his destination he has a 100% chance of getting there, so a probability of one.
If we were to generate a matrix for the Markov Processes from drawing above it would look as follows:
| Current/Future(Step) | 0 | 1 | 2 | 3 | 4 | 5 |
| 0 | 0.5 | 0.5 | 0 | 0 | 0 | 0 |
| 1 | 0.4 | 0.1 | 0.5 | 0 | 0 | 0 |
| 2 | 0 | 0.3 | 0.2 | 0.5 | 0 | 0 |
| 3 | 0 | 0 | 0.2 | 0.3 | 0.5 | 0 |
| 4 | 0 | 0 | 0 | 0.1 | 0.4 | 0.5 |
| 5 | 0 | 0 | 0 | 0 | 0 | 1 |
The left most column represents the current state and the top most row represents the possible future locations. As you likely noticed there are many zeros in the matrix, this is because we cannot transition from 0 -> 2, 0 -> 3, etc. The serialized nature of space-time requires the delivery boy to travel from block 1 through block 1 to reach block 2.
Once we have a probability matrix, we need to generate a step vector. A step vector is the probability at a given step the delivery boy will be in a given block. Mathematically:
S0 = initial step vector = [1, 0, 0, 0, 0, 0]
S1 = initial + 1 step vector = [0.5, 0.5, 0, 0, 0, 0] = S0 * (Probability Matrix)
It is possible to then iterate through this equation repeatedly as so:
The output being:
[[ 0.14174652 0.13991101 0.13621209 0.12999256 0.12142531 0.3307125 ]]
Which means, after 10 steps, the probability that the delivery boy will have delivered the pizza is 33.07%, since the last position in the step vector is the destination.
The graphs are very reminiscent of the sort of diagrams you’d use to visualize a state machine. A little googling reveals that Markov chains can be thought of as a subset of finite state machines.
Brainstorming possible examples of Markov chains:
Stages in a relationship — asking a girl out and further escalation. Each stage has some probability of progressing to the next. (Your continued relationship with Jenny can be modeled as a Markov chain! Confirming math as more beautiful than any woman. )
Great filter arguments for the Fermi paradox. Each stage of life has some probability of advancing to the next level of complexity.
The probability that a startup will be successful.
Calculating the distribution of taxi drivers.
Here someone uses it to estimate the probability a cryonics company will go bankrupt.
I was considering mentioning how it was very similar to finite state machines (it’s basically the same thing as an DFA/NFA), but opted against it because I felt it detracted from the article. However, i’m glad you noticed 😀
Also, you might be able to get statistics on relationships via/from OkCupid and test out the relationship stage idea…. I don’t know if I want to use math to compute beauty. It seems like that could get me into trouble hahaha.