
I’ve been hesitant to weigh in on this topic. However, I believe at this point, it’s clear there are a significant number of COVID19 vaccine deaths & risks. It’s a touchy subject, but please stay with me… I believe this is critical.
U.S. Vaccination Rate
Today in the United States 53% of the population have received at least one vaccines (pink) and 47% have received two vaccines.
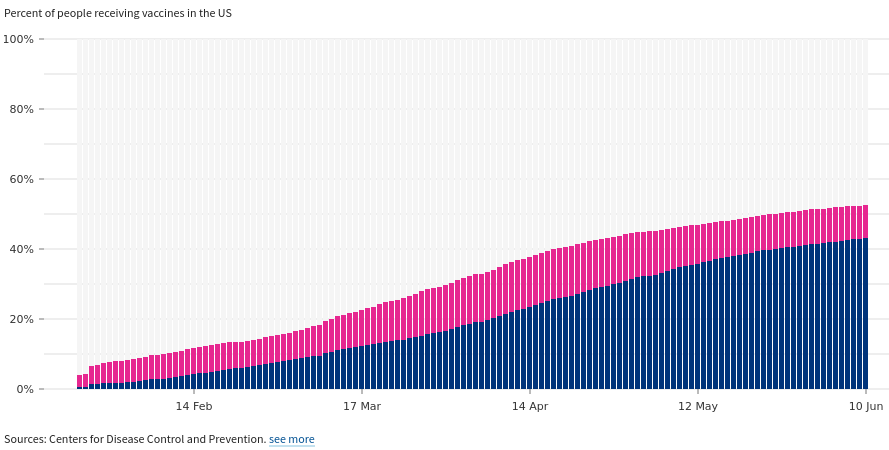
As it’s clear the rate of vaccinations is slowing, but still trending upward. It’s important to note that the vaccines take time to fully take effect (several weeks). However, it is also not clear how long the spike proteins stay in the body and we know the SARS-CoV-2 spike protein itself will lead to damage.
Vaccine Concentration, Reproduction & Cancer
This can be the same damage you see from COVID19; that being said, the spike proteins created from the mRNA vaccines are immediate and from multiple cells all system wide. With regard to Pfizer, we have an actual study indicating over a 48 hour period how the mRNA vaccine will effectively spread throughout the body.
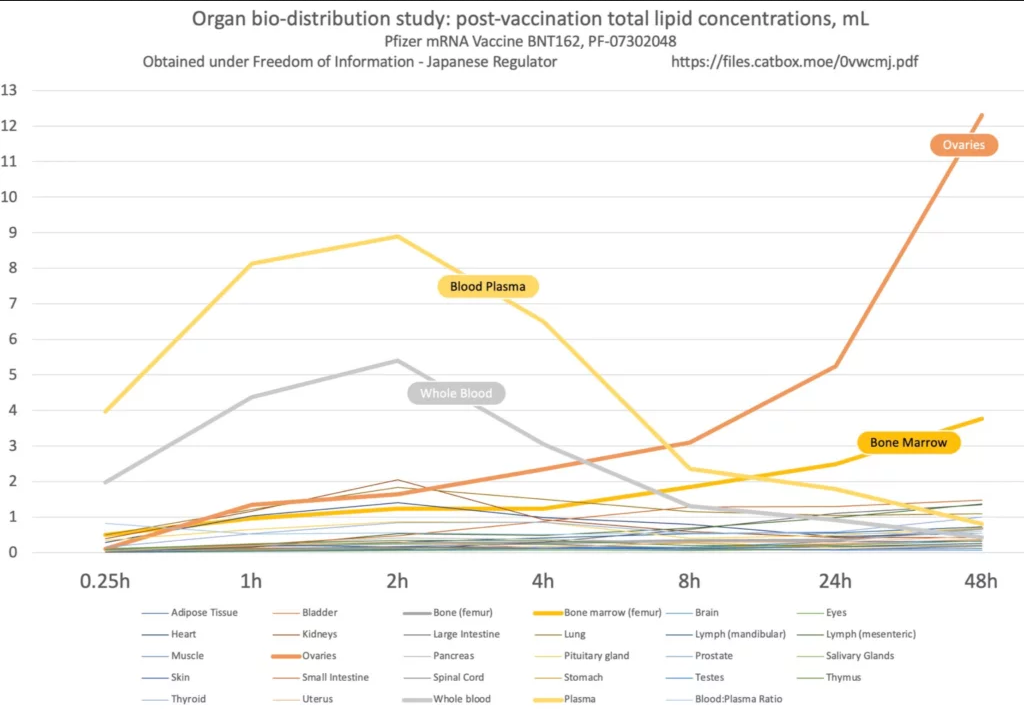
After a 48 hour period, the Pfizer mRNA vaccine will have the highest concentration in the ovaries and bone marrow (which still appears to be increasing); read Japan FOIA request document here. To add onto that, on December 1, 2020 we had two prominent scientists attempt to slow the vaccine rollout in the EU, claiming the vaccine could lead to infertility; read document petition to the European Medicines Agency.
Based on the data, there does appear to be potential risks related to autoimmune conditions and cancer (concentrations bone marrow) and infertility and genetic defects (concentrations in ovaries).
CDC Mortality by Week
The mortality rate in 2020 was fairly high above normal.
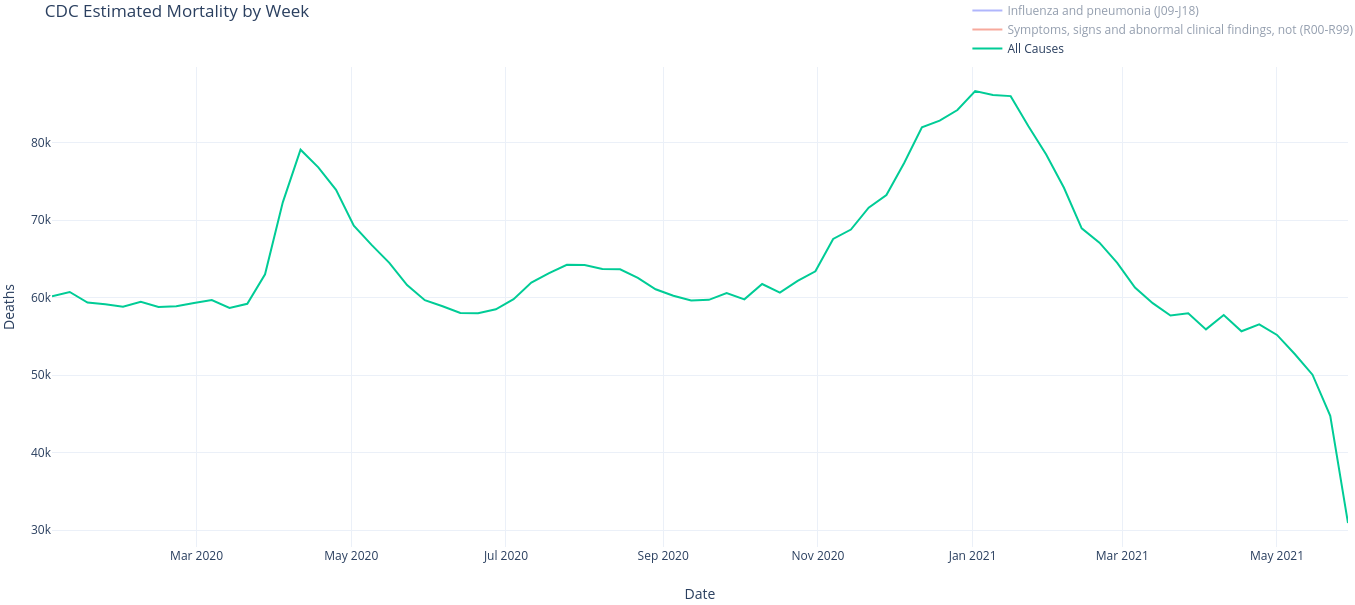
It’s important to note that the most recent few weeks does not have the complete data. Likely, there will be adjustments as much as a year or so later.
(Correction June 18, 2021) IMPORTANT NOTE ABOUT THIS SECTION
See Twitter thread: https://twitter.com/piercedgeek/status/1405996230753370117
Effectively, it appears the classification Symptoms, signs and abnormal clinical and laboratory findings, not elsewhere classified (R00-R99) always increases near the most recent dates. Below is a screenshot showing based on the date collected from the CDC, the number of R00-R99 classifications appear to be updated.
For a more detailed analysis see: Changes in the CDC Counts of Deaths by State and Select Causes. The magnitude of R00-R99 related deaths still appear to be increasing, at the same time the number of COVID-19 cases are decreasing. However, at this time, no clear claims can be made.
ORIGINAL ARTICLE CONTINUES BELOW

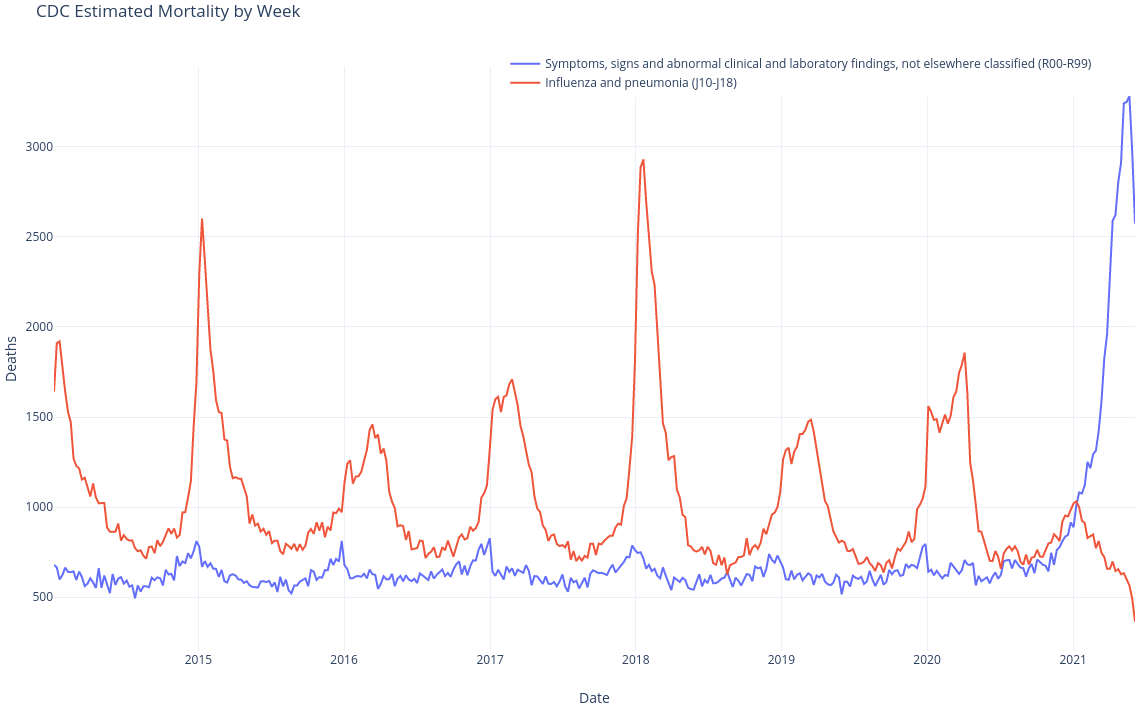
At this point, we will ignore COVID19 and multiple other forms of fatalities and focus on two in particular: Influenza and pneumonia (J09-J18) and Symptoms, signs and abnormal clinical and laboratory findings, not elsewhere classified (R00-R99).
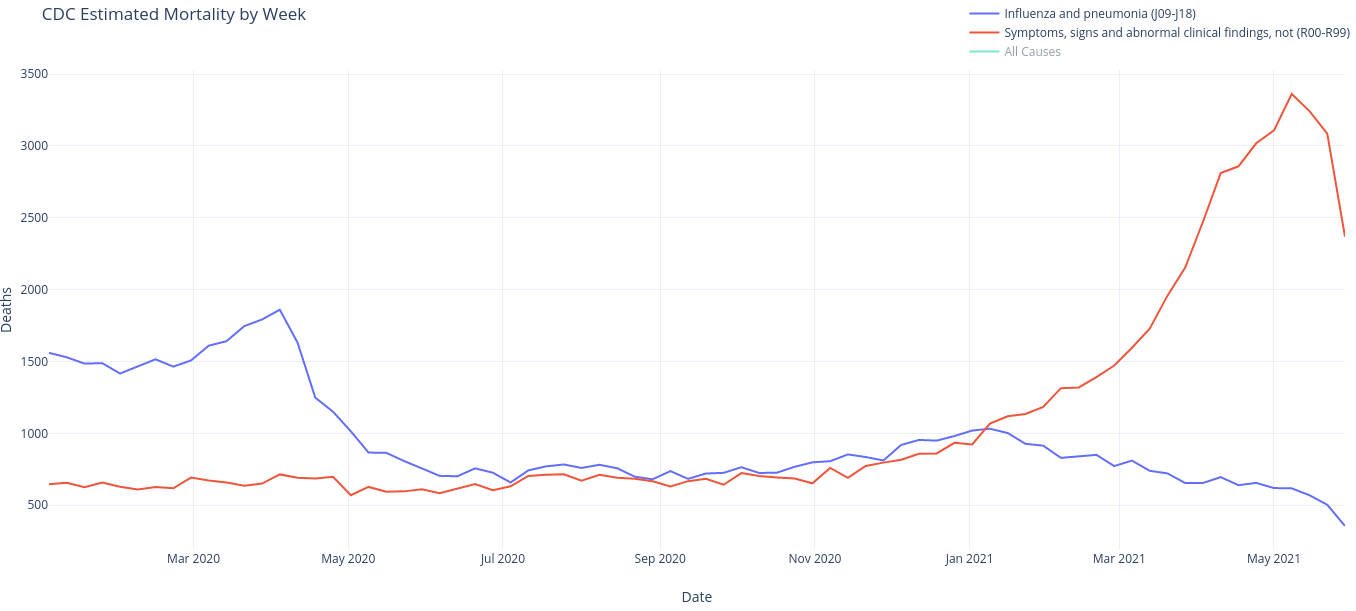
Based on the that chart, it appears since the vaccines have started to roll out there has been a significantly increase in the amount of deaths from Symptoms, signs and abnormal clinical and laboratory findings, not elsewhere classified (R00-R99).
What are R00-R99 codes? Here’s the ICD10 code:
The conditions and signs or symptoms included in categories R00-R99 consist of:
(a) cases for which no more specific diagnosis can be made even after all the facts bearing on the case have been investigated;
(b) signs or symptoms existing at the time of initial encounter that proved to be transient and whose causes could not be determined;
(c) provisional diagnosis in a patient who failed to return for further investigation or care;
(d) cases referred elsewhere for investigation or treatment before the diagnosis was made;
(e) cases in which a more precise diagnosis was not available for any other reason;
(f) certain symptoms, for which supplementary information is provided, that represent important problems in medical care in their own right.
What is clear, deaths associated with R00-R94 codes are 25,800 above the norm since February.
(Addition June 16, 2021) To really make it clear how well outside of normal this is, we look at historic CDC data we can see a dramatic spike in the R00-R94 codes – from 2014 through today June 2021.
 (Addition June 22, 2021) It’s important to note the R00-R99 codes will adjust later, i.e. re-attributed to COVID-19 or diseases of heart deaths. I do a bit of an analysis into that topic in a follow up article, Changes in the CDC Counts of Deaths by State and Select Cause. Yes, the R00-R99 are increasing over time. This is counter intuitive as the rate should be decreasing as there are fewer cases of COVID-19. In addition, it appears there are an increasing number of R00-R99 deaths being re-attributed to diseases of heart (see follow up article). That being said, it is still early and the data is unclear until the numbers stabilize in the next 6-8 weeks (at time of writing).
Vaccine Adverse Event Reporting System (VAERS)
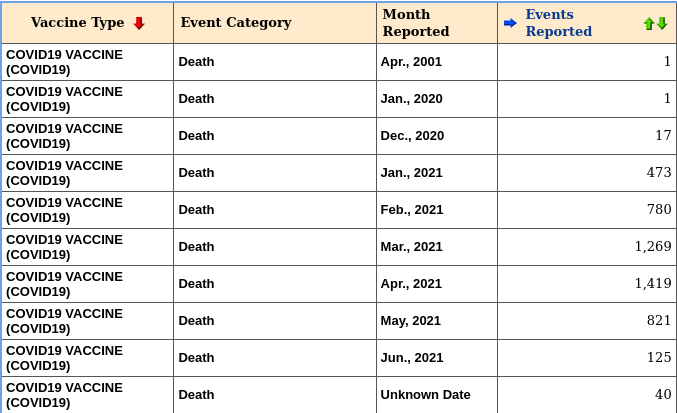
If we look into COVID19 Deaths in the VAERS dataset there are only 4,946 deaths associated with the COVID19 vaccines. Note, the VAERS database is known to be fairly heavily under reported (1-20% reporting rate) [2][3].
That being said, in this case it appears deaths are either under reported as expected or something has changed in the underlying CDC determination for R00-R99 codes.
Expert Discussion
If this interests you, below is a video discussing the biology and medical viewpoints summarizing some of what we know about COVID19 vaccines. One of the inventor(s) of the mRNA vaccines currently involved in several major projects related to COVID19 has a round-table style discussion.
(Addition June 19, 2021) Youtube removed the original video… Thankfully someone uploaded it to BitChute
Fantastic work Austin. You are my hero.
Hi Steve Kirsch,
I tried to watch your video on Vimeo regarding this and it got taken down. Do you have it on any other platform? Thanks.
Updated, check it out.
Thank you Steve and Austin for your diligence and courage!
Great video btw, also for us commoners could you please explain the acronym CDC? Thanks.
The U.S. Government agency Center for Disease Control
CDC is a foundation Although the CDC Foundation was chartered by Congress, it is not a government agency nor is it a division of CDC. It is a private, nonprofit organization classified as a 501(c)(3) public charity.
Hi, Is the year correct in row number 1 of the table at the end of the article? – Just checking
Likely a data entry error. But it’s pulled directly from VAERS. They’re often corrected by the CDC after an investigation (months later).
Ok, Thank you!
The chart you show from Byram Bridle is for lipid concentrations, not spike proteins. Dr Been on YouTube goes through the Japanese paper line by line to show that paper only presents bio distribution for lipids expelled from host cells following mRNA delivery, and does not include any bio distribution data on spike proteins (which the Japanese authors specifically state is not considered in their paper). I hope you can watch Dr Been’s video because your statement as to what that graph shows is not correct.
Can you provide a link I wasn’t able to find it but I’m curious? The above graph on this subject though seems to clearly state that its showing the lipid distribution. The question here is does the lipid distribution mean the spike protein is also distributed, or if that is not necessarily the case. Would be interested if this Dr. Been gets into this at all.
Thanks Donnie for pointing that out.
Don’t the lipids encapsulate the spike proteins? Would we see lipids without spike proteins? How would that work? Genuinely asking because I have a very rudimentary understanding.
I’m unsure, I believe there’s another study following up on this, but I’m not sure it will be public. My understanding on that is from the video at the bottom of the article
No, there is no reason to think lipids encapsulate the spike proteins, the graph showing lipid concentrations over time is published for the same reason the others showing death rates that are well within norms are, smoke and mirrors to stir up more anti vaccine nonsense.
My understanding is that what they could track, it is indeed unknown. That being said the lipid concentrations do potentially matter. We don’t know if the mRNA had been deployed yet, so it’s possible those cells are creating the spike proteins in those areas. I actually have been trying to find where the spike proteins collect and thus far have been unable to find where the spike proteins collect.
This is a very important objection. Could somebody please address it and clarify whether it is only the remaining lipid or the lipid plus the RNA -or the spike protein itself? Thanks!
Also, the Pfizer biodistribution graph was made using pharmacokinetics data on the Pfizer mRNA vaccine done in rats, not humans. Why has that not been made more apparent? Abraham Al-Ahmad claims that “the number of vaccines needed to be injected in a 12-year old to reproduce the findings observed in rats and reported as “terrifying” would be equivalent to 60,000 doses, given at once, to reproduce the number of nanoparticles”.
As I understand it, they are conducting a more detailed analysis now that wont be available until the fall — and it may not be available to the public. I’m not aware of Abraham Al-Ahmad claims. My 2 cents are that we haven’t done this research previously. I’ve reached out to quite a few people and no one I contacted knows where the vaccine payload ends up in humans… Which is concerning given what we do have.
why is such a miniscule dose of fragile lipid nanoparticle encapsulated mRNA concerning, it seems obvious if the spike proteins from the corona virus were actually dangerous, then the billions upon billions more spike proteins floating around the body of a patient infected with the actual virus would be a far greater concern
The virus may target particular tissues, the nanoparticles may migrate in a different way. For instance, I personally had influenza go from my lungs and infect my eye(s). That apparently is relatively common (infecting lungs and eyes). However, influenza does not typically infect cells around genitalia or bone marrow. Even avian and human influenza will attack different cells.
https://www.pnas.org/content/101/13/4620
These vaccines are really really dangerous. The fact that all the deaths are being covered up, and all the severe side effects are underreported tells you something, it tells you that we are being experimented on against the Nuremburg code violations and medical crimes against humanity are being carried out. You can see all the laws and exemptions against vaccines that are being violated https://maskexemption.cards/product/vaccine-exemption-card/
The normal range for R00-R94 from 2014 to end of 2019 (see image) is from about 4,000 to 7,000. The mystery is why it is so low for 2020. This ‘huge increase’ seems to be an anomaly, but if you compare it to previous years it isn’t.
https://data.cdc.gov/NCHS/Weekly-Counts-of-Deaths-by-State-and-Select-Causes/3yf8-kanr
I pulled the data via plotly and it appears the average is similar to normal, you can see the massive spike. Updated the post to contain the historic data thank you!
But how are you drawing causation from this?
Correlation is not causation. Even if the deaths attributed to R00-R99 were triple the deaths in 2019 you cannot prove causation.
Indeed! Never proved causation, just put the information out there.
I’m sorry, but at the beginning You’ve written “… it’s clear there are a significant number of COVID19 vaccine deaths & risks…”
How could You make such claim, if no causation is proven?
DISCLAIMER: Medicine is not my area of expertise, so it’s possible that I’m missing something important that is actually Your text.
But overall, since still so much is unknown about the long term consequences of Covid, isn’t it possible that a part of these deaths, that have been unaccounted for, could be attributed to Covid, not to vaccines?
Thanks for the thorough and scientific presentation of facts. With the masses hypnotized, their prefrontal cortex, i.e. capability to think being switch off by fear it’s an uphill battle that unfortunately won’t be won with facts and scientific discourse alone. I do hope there will be Nuremberg trials 2.0 for these criminals.
Exactly Laura, and to tie this in to biblical prophecy, Revelation 20:4.
The forehead is the pre-frontal cortex comprised of the frontal lobe whose in charge of decision making and logical step by step planning, morals, and emotional control.
Thank you for this profound content, and let’s keep sharing the truth!
Interesting topic. Unfortunately, there are obvious institutional efforts to elevate and amplify 1) fear of Covid 2) the safety and effectiveness of the vaccines. Simultaneously, there are explicit efforts to suppress and minimize any information that could be interpreted as 1) minimizing the threat of Covid 2) questioning the safety (or lack thereof) of the vaccines.
This claim renders me a conspiracy theorist by those who find the mainstream narratives compelling, but it is objectively known thanks to leaked documents that Facebook instructed its content moderators to purge posts that could be viewed as increasing “vaccine hesitancy”, including people posting about their own personal adverse effects from taking the vaccine, or any news/blogs/data that reflect unfavorably on the vaccines. “That’s just one company, and the approach is valid because all they’re doing is preventing bad actors from spreading misinformation”. Anyone who still thinks this isn’t worth engaging with. They can’t be persuaded, just ignore them – they need to find the truth themselves, you can’t show it to them.
Hello Austin,
In the data table shown, in the first row of the table, it says the year as 2001. Can you please check if this is an error? – Thank you – Madhavan
It was probably an error, but it’s not on my side it’s on the VAERS database side. My guess is someone accidentally typed 2001 vs 2021. It happens.
I am trying to replicate the graph of R00-R99 weekly deaths from the CDC data but have yet to succeed in doing so. Could a non-png version be released?
Steps:
Debunked. https://twitter.com/piercedgeek/status/1382762602804211716
I hate the word “debunked”, honestly I almost marked you for spam. However, let’s clear this up. I’ve updated the article with some of the discussion on that thread. There is actually still an increasing number of R00-R99 over time. That said, we don’t know why or how many. We wont know for sure for 6-12 months. The rest of the data in this article are still relevant (VAERS, FOIA request and experts).
There’s a mistake in how you’re reading the data from the CDCs weekly death counts. That code is often assigned before test/autopsy results come back, and later updated with a more detailed code. Meaning, they are mostly temporary. You will always see a “recent spike” any time you pull this data.
If you don’t have older copies of the file to compare with, you can get one from their archives here:
https://data.cdc.gov/NCHS/Weekly-Provisional-Counts-of-Deaths-by-State-and-S/muzy-jte6/data
(click “more views” up top and “Dataset Snapshots” on the left)
Also a new one dropped yesterday, that could be compared to yours which is probably from last week, you’ll see the “hills” shift forward slightly.
It ends up looking like a moving wave every week.
Let me know if that makes sense or not, I can try to explain it differently if not
See update. I appreciate your discussion on twitter.
I’m pretty sure those R99 coded deaths will go down over time. They are likely just high right now because you are pointing out the most recent months. I’ve read that R99 is often applied to cases of drug overdose prior to autopsy. And it seems they’ve also been involved in some situations lately where they are awaiting confirmation of results from a covid-19 test. You might wait and see if those numbers start changing at all as the weeks go by.
https://www.cdc.gov/nchs/data/nvss/coronavirus/Alert-2-New-ICD-code-introduced-for-COVID-19-deaths.pdf
https://covid19science.blogspot.com/2020/05/how-to-not-count-covid-19-death.html
I’m pretty sure those R99 coded deaths will go down over time. They are likely just high right now because you are focused on the most recent months – which are “provisional” and continuously updated. I’ve read that the R99 code is often applied to cases of drug overdose prior to autopsy. And it seems this code has also been involved in some situations lately where they are awaiting confirmation of results from a covid-19 test. You might wait and see if those numbers start changing at all as the weeks go by. Better yet, you might generate the chart for R00-R99 codes again now that an update came out June 16th. I imagine you’ll notice slight differences between the two charts if you look closely. That’s because it’s still updating.
https://www.cdc.gov/nchs/data/nvss/coronavirus/Alert-2-New-ICD-code-introduced-for-COVID-19-deaths.pdf
https://covid19science.blogspot.com/2020/05/how-to-not-count-covid-19-death.html
See the update
As of May 28, 2021, VAERS was reporting 5,165 deaths from the COVID19 gene therapy injections. As of today, June 17th, it is closer to 6,000. VAERS is ALWAYS underreported since most don’t know it exists.
Please, stay on this data. History will record this as genocide.
1st of all i share the skepticism,
however, you have to consider the baseline death rate, and that MD’s are “required” to report any deaths, following vaccines, even if they seem unlikely to be the cause. Since you are vaccinating on mass scale (1/2 the US population already), it is expected to be ups on VAERs reports just based on the baseline rate alone.
The death code you are citing is mostly temporary, and gets updated later with a more detailed code after labs and autopsy results come in. In short, there is ALWAYS a “recent spike” for this code looking backwards, no matter when you pull the data. Why are publishing disinformation without thinking for yourself? This exactly explains the discrepancy. https://pbs.twimg.com/media/E379x76WEAEunsf?format=png&name=large Also: the guy you call “inventor of mRNA vaccines” has not really worked with that topic after one of his early papers. Calling him the “inventor” is a huge stretch. Also he does not really seem to be on the latest in this topic, there is balant and easy to disprove disinformation promoted in the video too, read this also: https://www.politifact.com/factchecks/2021/jun/16/youtube-videos/no-sign-covid-19-vaccines-spike-protein-toxic-or-c/ Your disinformation is used as source for anti vaccine people. What about you clearly mark a correction (ON TOP) of the article where you correct your disinformation and publish a seperate article on your mistake? Would be the least you could do.
I wouldn’t rely on “Politifact” for your facts. They are propaganda and can’t be taken seriously. Remember how they gave all Wuhan lab-leak stories “Pants on Fire” ratings? Yeah, I’d trust them for my “facts”…
Hi Austin. The Japanese FOI report you linked doesn’t include the graph you included. Could you please include a link to the original Japanese FOI report that shows the graph included here? Otherwise, we can’t be entirely sure that the chart did in fact originate from that FOI report.
It’s in the comment for the image, here.
Hi,
If your claims about excess deaths caused by vaccines were true, then they would be visible in data from Europe as well, right? After all we have the same vaccines.
Here is a very good visualization of deaths in Europe in the last few years:
https://www.euromomo.eu/graphs-and-maps/
And here data on vaccine rollout:
https://qap.ecdc.europa.eu/public/extensions/COVID-19/vaccine-tracker.html#uptake-tab
For me it’s quite clear that if there is a correlation between the two then it’s an inverse one.
Would you care to elaborate on that?
The graph on estimated mortality is misleading. The R00-R99 code is a temporary code that gets updated after the fact once the details are known. To see for yourself, go to https://web.archive.org/web/20210527154720/https://data.cdc.gov/NCHS/Weekly-Provisional-Counts-of-Deaths-by-State-and-S/muzy-jte6 and click on Export -> CSV. You will notice there is always a recent spike as the data is constantly revised down. Please consider updating this page as the conclusions drawn are incorrect.
See updates
Shouldn’t “lipids expelled” be cleared through the lymphatic system, why would they end up, of all places, in ovaries & bone marrow?
Not necessarily, clearly not in this case.
I got the the last 5 minutes or so and YouTube deleted it ….where there antidotes? Is this up anywhere else?
Updated, check it out.
The video has been pulled by YouTube, is there somewhere else I can see it. I was halfway through. Thanks
To my dissapoinment I saw that YouTube removed the video. Is it somewhere on Rumble or so? I don’t agree that people need to find the truth for themselves. There also has to be thoughtleaders and fighters against crimes against humanity. This coup d’mind is already going on for decades and has a lot to do how the goverment system is modeled. Also the perfected use of NLP and neuromarketing shows flaws in our old way of having a consicous mind. A child is up to 7 years a lot in theta-state ie hypnosis. So a lot is implemented whitout the control of the critical mind(fulness). School systems make it – far – wordse. Spreading fear by our non chosen rulers can in the end work adverse on people because they overcome it.
Updated it’s on BitChute.
“What is clear, deaths associated with R00-R94 codes are 25,800 above the norm since February.”
The chart says 2,500 not 25,000 (apologies if I’m reading it wrong).
25,800 was the number under the curve, not the peak.
the video was removed from youtube mob, do you have a backup link please? thank you
Updated, feel free to watch
This is a great video from 60 minutes from back in 1976, covering the swine flu outbreak in the US and subsequent mass vaccination program which was halted due to people getting GBS and other problems. Meanwhile, with ongoing censorship about vaccine side effects, people still believe the experimental covid vaccines are safe, because they’re not being told the full picture with transparent data.
Repost with link…
This is a great video from 60 minutes from back in 1976, covering the swine flu outbreak in the US and subsequent mass vaccination program which was halted due to people getting GBS and other problems. Meanwhile, with ongoing censorship about vaccine side effects, people still believe the experimental covid vaccines are safe, because they’re not being told the full picture with transparent data.
Watch it before it gets censored:
https://www.youtube.com/watch?v=Gm4CxKQBvzs
My apologies, data is weekly thus cumulative between time. Sorry!
Your YouTube link appears to have been sensored… is their an alternate source of the video?
R00-R99 is including all the “unknown” cause of deaths. Of course it will be higher in the immediate past, and be lower once the deaths have been figured out. I graphed the current data as well as the available snapshots of the data from points in the past (You can see them by clicking More Views -> Dataset Snapshots here: https://data.cdc.gov/NCHS/Weekly-Provisional-Counts-of-Deaths-by-State-and-S/muzy-jte6/data). It’s obvious that this spike in R00-R99 has no meaning at all, it’s just saying that we don’t have the causes of deaths yet for those people. Hate to break it to you, but the vaccine is very safe.
https://ibb.co/ZXrcwHT
The CDC data on weekly deaths you cite ends in 2019. Where are you finding data up through 2021? Thanks! Keep up the great work!
Combine the original set (2020-2021), with the historic data (2014-2019).
It seems that the youtube video was taken down. Do you remember what the title was?
Regarding the CDC data, I have been analyzing the data and made a couple of observations that seem to show that this claim may not be accurate. At least as far as I can tell.
The first indication was observing many other causes of death steadily decrease to below average from roughly the same point at which R00-R99 increases. (December-January 2021). They are all lower than average compared to previous years.
This led me to question whether the R00-R99 are deaths that have yet to be categorized. Possibly due to the lag time of lab results, or data entry. I then downloaded the same data from internet archive files to see if this pattern of increased R00-R99 occurs any time – even those prior to the vaccine campaign. Specifically using waybackmachine I downloaded the excel weekly data from November 13 2020. The same trend occurs. For the previous 24 weeks up to the point of recording, deaths in this category will appear above average (using 800 as an average – and it begins to increase exactly when you are noticing this increase – around the 24-28 week mark. Using the same calculation of 24 weeks prior to October 31 2020, total R00-R99 deaths account for 41985 – using your formula this would show 22785 above average deaths at a time of no vaccination. Which may be less than your 25,800 due to the higher death rates that occur in winter-spring months – as can be seen in previous years.
You will also see that currently on the CDC October 31, 2020, shows 643 death in the United States under R00-R99.
https://data.cdc.gov/NCHS/Weekly-Provisional-Counts-of-Deaths-by-State-and-S/muzy-jte6
– the November archive file was showing 2316 deaths under R00-R99 in the united states. See excel file.
I would assume this means that these deaths have now been categorized.
Regarding VAERs data. I am skeptical of this data given that it is an opensource platform. Prior to covid I would agree that underreporting of side effects plays a role. However, due to a strong opposition to experimental vaccines this has become an easy target for those attempting to put an end to the campaign, thus ending any discussion regarding a mandatory vaccine, or what they see as a crime against humanity.
November 2020 data
https://file.io/dkaU4bdkTG9h
See the updated correction. Appreciate you reaching out and pointing it out. I had monitored for a couple of weeks and it wasn’t apparent. Based on what I’ve gathered from looking at historic data — COVID19 really caused a spike to R00-R99. It’s still increasing overtime which is interesting, but I agree it’s less indicative of an issue or at least less clear what level that is at. We probably wont know for 20 weeks or so.
I’ve got a suggestion for you. Since the conclusion isn’t clear, how about pulling this article until you have conclusive evidence that unexplained deaths are actually higher? It seems irresponsible to post something that could be entirely wrong and just say “let’s wait 5 months and then we’ll update it”.
I appreciate the suggestion, however — only one component hasn’t been fully flushed out yet. The increasing unexplained deaths.
Generally, I think it’s something to be monitored. I think it’s “highly likely” these are vaccine related events at this point. Should we stop the vaccine? I have no idea, but I like to document what is happening to the best of my ability.
Thank you from the bottom of my heart for this excellent presentation!
You offer another glimmer of hope, as I’ve noticed more and more people speaking out in the past few weeks!
Can you please point to a causation and not R00-R99 correlation? I am having a hard time with your data.
You go from showing correlation of “vaccines happened at this time” to “these deaths are catagorized as “R00-R99” which are deaths without known cause to “clearly these deaths must be vaccine related”
How are you concluding this from deaths catagorized as unknown?
I never claimed they were vaccine related. I think it’s interesting and the correlation(s) seem to be interesting, so I wrote it up. See correction as well. It’s still increasing above the norm, but it’s not clear to the degree. The rest of the data indicates there’s issues outside of R00-R99 as well.
Austin, if you use the same data and look at covid deaths vs natural causes there is a very strong relationship. Would like to know what people think could be causing this..
https://media.patriots.win/post/OZW11mL4.png
I actually agree, but I think that’s a mislabel of data. It appears COVID19 is also being treated as “natural causes”.
Austin, so with the latest correction from June 18th there is no point anymore in this article, right?
The data from CDC do not reflect an increase of deaths since the last months (possibly linked to the vaccination)…
To an extent, however…
Basically, I still think there is a lot there to work with, however the numbers originally presented may be incorrect (we actually don’t know yet and probably wont for 6-12 months).
With regard to the FOIA request info, I encourage you to read these articles and make corrections. Malone and Kirsch are merely trumpeting Bridle’s misleading and false claims about that data.
https://healthfeedback.org/claimreview/byram-bridles-claim-that-covid-19-vaccines-are-toxic-fails-to-account-for-key-differences-between-the-spike-protein-produced-during-infection-and-vaccination-misrepresents-studies/
https://sciencebasedmedicine.org/covid-19-vaccines-are-going-to-sterilize-our-womenfolk-take-2/
The concern about the Vaers reporting is just an old, recycled anti-vaxx talking point that has been thoroughly debunked.
https://sciencebasedmedicine.org/covid-19-vaccines-as-dangerous-continue-apace-vaers-edition/
I’m approving this, but ultimately I disagree on the term “debunked”.
I read your link(s). I did find it interesting Steven P. Novella is the editor of “sciencebasedmedicine.org” Yet, the skepticism towards this particular platform of vaccines (mRNA vaccines) seems non-existent. Even though they are almost untested, particularly for children.
Anyway, I presented facts and made no claims. Although I’ve been neck deep in the COVID19 (past year) and CDC data for years. I’m also not generally anti-vaccine(s), in this case the data points to a potential issue and your links don’t really counter my position or concern.
My point — It’s an untested vaccine for an illness that only increases your risk of death in a given year by 0-20% depending on age range. The side effects from the vaccine are unknown AND the vaccine utilizes the spike protein, which your own link states is still in the process of being evaluated, as there are indicators it causes cell death.
I stated facts.
Nothing linked changes those facts.
I appreciate you taking the time to read the links. To be clear, the claim is actually that vaccine contents accumulate in reproductive region & bone marrow AND that this is alarming/causes harm. The links absolutely dispute that.
* According to Ogata et al., which the claim is derived from – extremely low levels of spike protein were detected in the bloodstream of humans.
* This level has been calculated to be approx. 100,000 times lower than the levels of viral spike protein shown to cause harm. https://www.deplatformdisease.com/blog/spike-protein-circulating-in-the-vaccinated-what-does-it-mean
* The FOIA Japan rat data used a dose 18-35x the vaccine dose given to humans.
* 50% of vaccine stayed at injection site and then was metabolized by the liver
* Less than 1% of the vaccine went to the tissues of the rats
* .1% of the vaccine dose accumulated in the ovaries of the rats
* The accumulation of LNP in the ovaries looks high because the ovaries are tiny
Infection with the Covid-19 virus itself is what can cause high levels of damaging spike protein to circulate through your body. The vaccine offers protection from that.
The link for the data on biodistribution leads to a document which explicitly indicates almost no accumulation in ovaries or bone marrow. What is the disconnect? This is major claim and needs clear documentation.
See figure 2.6.5.5B – It’s on page 7
tldr
I think it’s important to point out some misinformation in the section relating to the vaccine concentration after injection. You say “After a 48 hour period, the Pfizer mRNA vaccine will have the highest concentration in the ovaries and bone marrow” but this is simply untrue. The data shoes that after 48 hours the highest % of the total dose is found at the injection site (24.6%) with the second highest, quite expectedly, found in the liver (16.2%). Only 0.1% of the total dose reached the ovaries after 48 hours. Being charitable, you have conflated the lipid concentrations vs. the % of the total dose to make the previous claim. I believe this deserves a correction similar to that which you made for the R99 codes as it is very misleading. It might also be worth mentioning that this was not a human trial but rather one conducted on rats with 1,333 times the regular vaccine dose.
Austin you are a genius.
Your statement that the “mortality rate in 2020 was fairly high above normal” isn’t correct as it seems … in 2020, it was even lower than in 2019, although there weren’t even vaccines available in 2020 – I found that quite interesting.
Source: https://knoema.com/atlas/United-States-of-America/Death-rate , but there are others as well. The same applies even world-wide: https://knoema.com/atlas/World/Death-rate
They are talking about how dangerous the vaccine is, but they BOTH got the vaccine? Can someone explain that to me?
The graph you show about organ distribution of the Pfizer vaccine doesn’t actually occur in the Japanese FOIA document you link to. Who created that graph? It appears to have been generated from the tabular data marked 2.6.5.5B in the Japanese document. If so, I think there are some significant points of misinterpretation involved in creating the graph. First, the graph fails to show the concentration at the injection site, which is about 100x higher than anywhere else in the body (and the injection site is where the vaccine is intended to be active). Also, the data was for rats, not humans, and it also doesn’t seem to have been done with the actual vaccine but rather with surrogate lipid nanoparticles designed to act in a way which would be similar to the way the vaccine is expected to act. Finally, your statement that this data seems to indicate a risk of cancer or other harm seems quite unjustified to me. Just because a small fraction of the vaccine ends up in those organs after 48 hours doesn’t mean that it causes cancer. Without additional evidence, that would be like saying “Joe has just taken a drink of liquid. He may die from that soon” without identifying whether the liquid is water or a poison.
Austin, have you looked at the VAERS data for the J&J vaccine? I am curious as to whether there’s a big differential compared with the gene-therapy vaccines? If there isn’t, the hypothesis of the spike protein explaining the data would not hold. If there is, it would amplify support for the hypothesis.