
On March 21, 2020, I wrote an article discussing how COVID-19 could impact the economy. Throughout that article I made a prediction that we will see one million fatalities in the U.S. by 2021 from COVID-19. Today, we have more information than on March 21st, so I’m going to update the prediction.
At a high level, my prediction for March 21, 2021 is stark:
- 1.5 million dead
- 15% reduction in real GDP
- 25% unemployment
Prior COVID-19 Prediction (March 21, 2020)
The prior predictions were:
- Between 1,000,000 – 1,500,000 dead by March 21, 2021
- Lockdowns would start to end in May and continue through July (still generally “social distancing”)
- New lockdowns would begin in September to October
- People will ignore lockdowns around the holidays
- After January 1, 2021 people will start respecting lock-downs again
State of COVID-19 Information (April 30, 2020)
As of April 30th, we have more information. We know there is a high probability that:
- A vaccine will not be widely available for 12 months (general consensus at the moment)
- A vaccine will probably not be 100% effective (see similar vaccines)
- Donating plasma will probably be somewhat effective [1]
- The fatality rate appears between 1% to 10%, overall on the lower side[2] (1% in U.S.)
- No therapeutic drugs have been proven effective to date
- Ventilators assist with breathing and are the most effective life-saving treatment
- Antibody studies indicate between 1% to 20% of the population has been infected[3] (initial results)
- In confined spaces, infection rates are very high[4][5]
Unfortunately, we still have the same unknowns:
- If reinfections can occur and if so how long
- How quickly the virus is mutating
- The true infection rate
- The true fatality rate
COVID-19 Analysis
With a background in data science, I am naturally inclined to apply those skills to analyze the situation.
One of the best simulations I found was created by Research group of Richard Neher at the Biozentrum, University of Basel. I used their simulation in the previous article to emphasize that multiple major lock-downs would be needed. Thus far, their simulation software (when tuned) has been aligned with my analysis.
Even assuming we have a hundred thousand ventilators available instantaneously where needed, the we will need a lot of lockdowns…
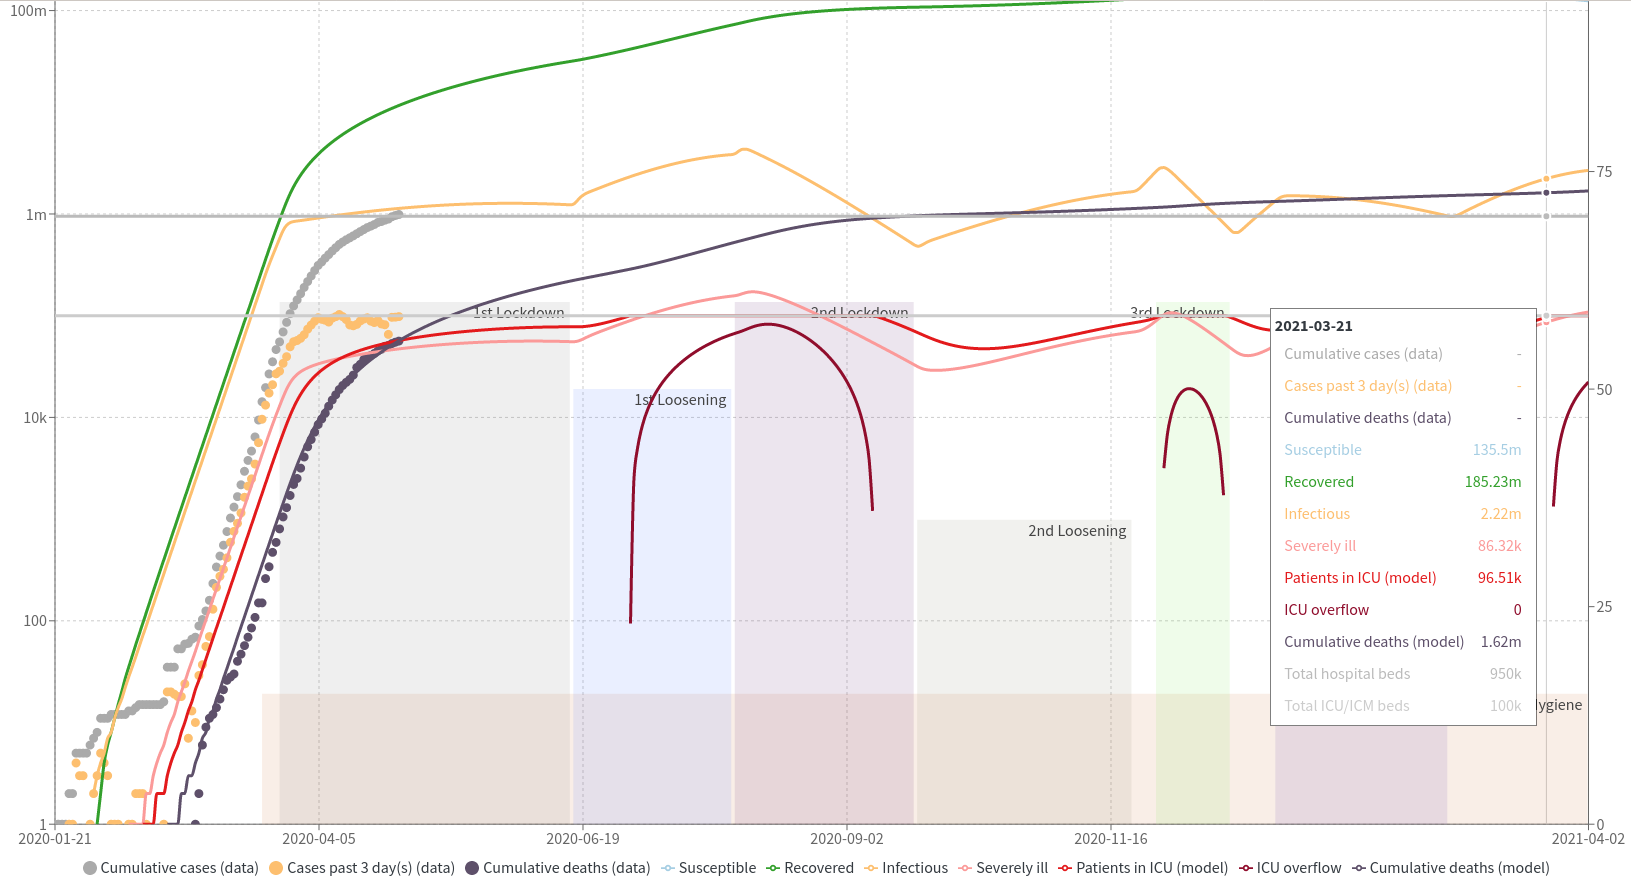
The full report generated (along with the input values) can be downloaded here or you can manipulate it yourself. Generally, the simulation has followed the best trendine we have [deaths] perfectly. This simulation assumes a 60% reduction in interactions, which seems to match Google’s mobility report (i.e. changes in where Android users have spent their time).
Personal COVID-19 Analysis
Further, the simulation and real figures match the predictions I’ve been running (Google Sheet link). Regarding my prediction — I took a few cities in the United States and gathered statistics via the John Hopkins U.S. Map. I then assumed we are only identifying 1/20 of the real cases and applied a 2.5x multiple to the current deaths. This accounts for the lack of testing and future deaths of those infected. From there, if we assume a 65% infection rate by March 21, 2020 we can expect 1.5 million deaths, with a fatality rate around 0.86% (around 8x the flu).
The reasoning behind doing a 20x multiple for true infections, is that testing capacity is severely limited, with only 0.1% of the population being tested per day:
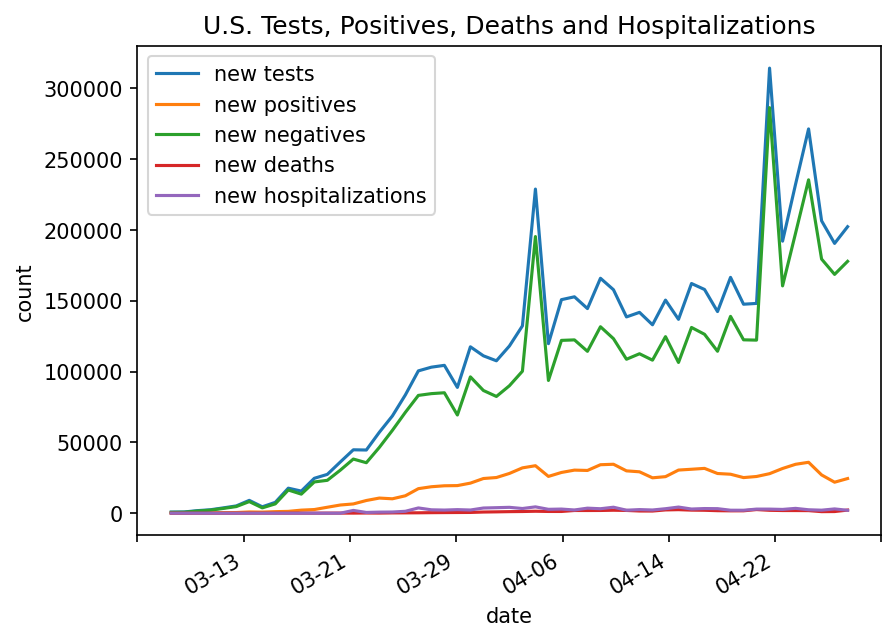 While that may sound like a lot of tests, individuals can test negative before and after having the virus, so the window is fairly narrow. Further, nearly 20% of tests in the U.S. are coming back positive:
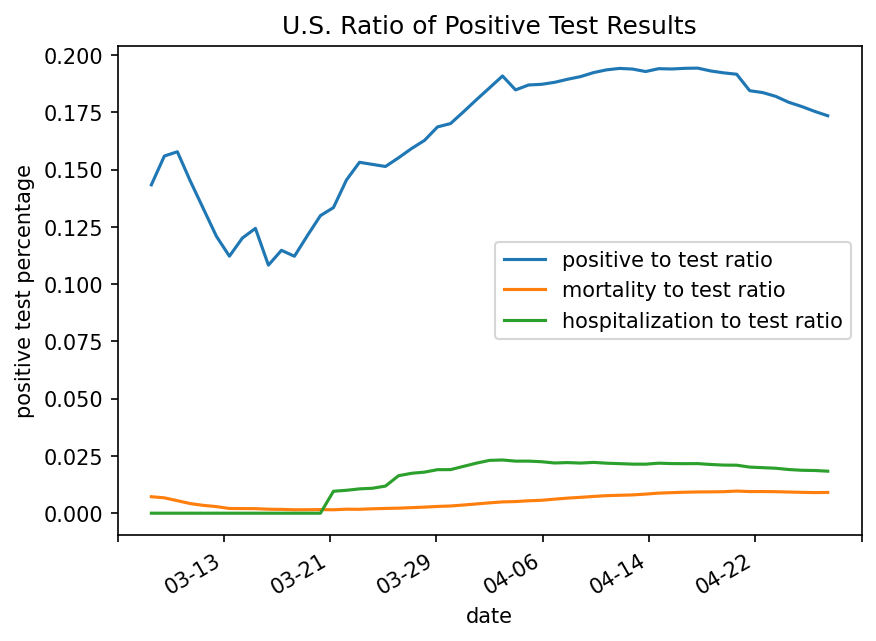 Ideally, the number of tests coming back positive would be very near 0%, as such you can be confident in the real numbers.
As it stands, there is a large level of uncertainty of true numbers because of the high positive test ratio, as well as those who’ve had the disease and weren’t tested. A discount rate of 20x doesn’t seem unreasonable to me, but it’s simply a guess.
The data & code for the above graphs can be found on my github.
Economy Analysis
As mentioned, lockdowns will have to continue to reduce the fatality rate. I find it hard to imagine a world in which the government knowingly lets millions die.. so social distancing / lockdowns will continue — meaning high unemployment.
How high, you ask?
According to the Bureau of Labor and Statistics, in 2018 (rough numbers):
- 25% of the U.S. was employed in either Retail, Hospitality, Education, Transportation
- 34% of the U.S. was employed in either Business, Financial, Information or Government Services
- 13% of the U.S. was employed in either Mining, Manufacturing, Construction or other Product Production
- 13% of the U.S. was employed in Medical Services
- 2.5% of the U.S. was employed in the Agriculture business
- 5.5% of the U.S. was self-employed (small businesses)
- 7% of the U.S. was employed by the remaining sectors
The categories in bold above account for ~30% of employers in the U.S. and so long as there is in any kind of “lockdown” they will suffer.
Unemployment Due to COVID-19
I’m going to speculate an 80% reduction in workforce (based on the airline industry) in those sectors. The 24% reduction in overall employment will ripple into the remaining sectors, namely: business, financial and government services. Tax revenue will fall, loans will go into default, businesses will lose revenue, etc. Honestly, in the remaining non-production / healthcare sectors, I’d expect a contraction of about 20%.
In terms of job losses that amounts to:
- 33 million unemployed in Retail, Hospitality, Education, Transportation
- 13 million unemployed in either Business, Financial, Information or Government Services
- 2 million unemployed self-employed (small businesses)
Assuming no losses in any other sector, that’s 48 million unemployed or around 30% unemployment. Assuming some of the other sectors grow, overall by March 21, 2021 I am going to predict a 25% unemployment rate.
GDP Reduction Due to COVID-19
Finally, the nominal GDP of the U.S. will not drop nearly as much because much of the wealth creation comes from inflated figures from the FED / U.S. Treasury manipulations.
However, I would expect real GDP to drop by some 15%. There aren’t any hard numbers behind this, but generally 5% per quarter. I believe most of the hard “value creation” industries are “essential” and highly automated. Thus, I suspect the GDP reduction will simply be due to the lack of purchasing (rather than production capacity).
Updated COVID-19 Prediction
With all the available information, it seems reasonable to conclude that by March 21, 2021:
- 1 – 2 million COVID-19 deaths in the United States is likely
- 25% unemployment in the United States is likely
- 15% reduction in GDP is within reason
This is on track with my previous prediction five weeks ago and hopefully I’m wrong.
I agree and think most of the USA is sticking its head in the sand. I mean, Trump was saying 60k deaths total not even a month ago. The next couple of months will tell the tale as the USA starts to reopen. Maybe summer combined with people on high alert will keep the spread low, or maybe it starts to spread out of control again. Many of the lost jobs will not be coming back anytime soon, regardless of opening back up. The biggest question I have is how long immunity lasts for those who have been sick. If it’s only around a year or less, that will be a big problem.
India and Africa have both been pretty much fine up until now. If they see a spike, it may cause untold deaths.