Singular Value Decomposition (SVD) is a factorization of a real or complex matrix, which can then be used in various methods. If matrix M is a real m x n matrix, where m > n we can obtain the following from factorization:
In the formula above,
- U represents the unitary matrix, which defined as the orthogonal matrix in a real matrix, according to wolfram:
Each row has length one, and their Hermitian inner product is zero.
- The Σ represents diagonal matrix, which are simply the variables on the main diagonal of the original matrix M.
- V* represents the conjugate transpose of a unitary matrix of matrix M.
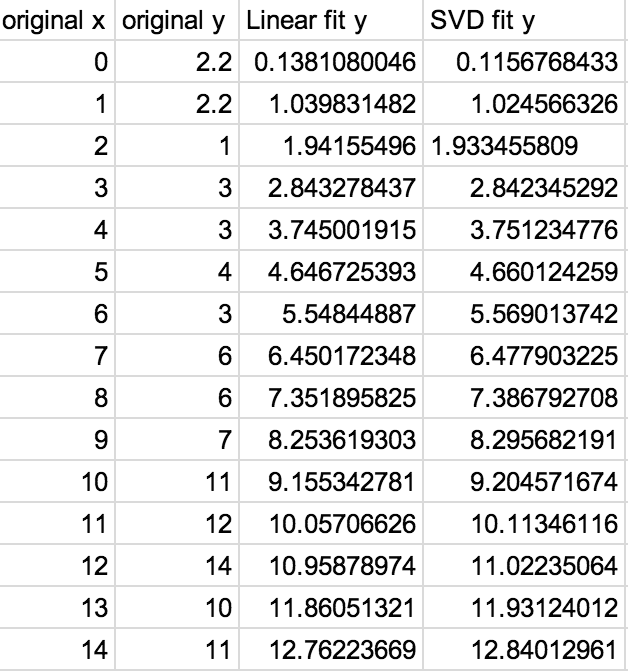
It has been known that SVD can be used in regression analysis since the early 1980’s [1]. This example is intended to demonstrate how to do so in python. I previously did an example where I found a Linear Regression using a more standard method. I will be using the same data, here are the results side-by-side:
Both ways of determining a linear regression line have nearly identical results.
Programming Singular Value Decomposition
As opposed to factorizing the A matrix yourself I would highly recommend decomposing the matrix with numpy, ‘r’ represents the regression line (the first value represents the slope, the second the starting point) like so:
This is relatively straight forward and with numpy it becomes trivial to program. The ‘r’ array I obtained out of this function with the above data was:
[0.90888948 0.11567684]
or
y = (0.90888948)x + 0.11567684
If we then wish graph the linear regression line all we have to do is iterate over each x value and output a y:
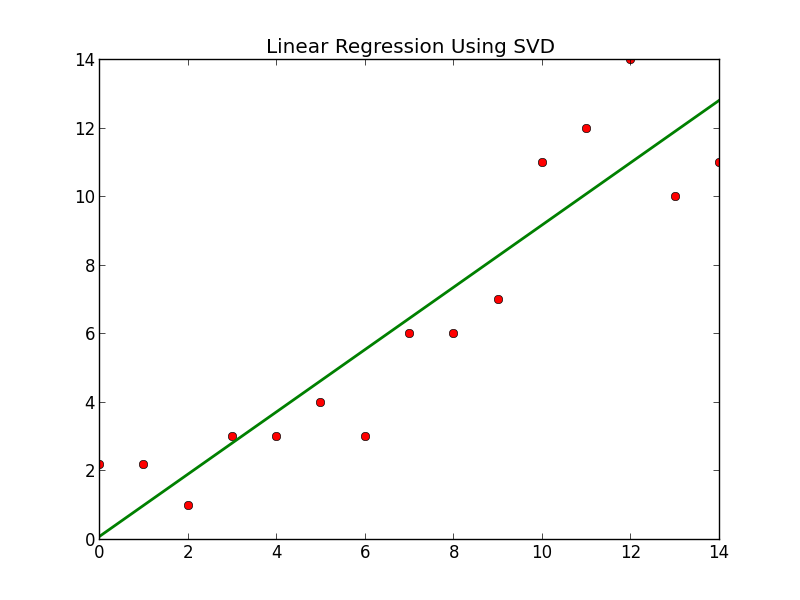
If we then graph the line, along with the various points we obtain the following:
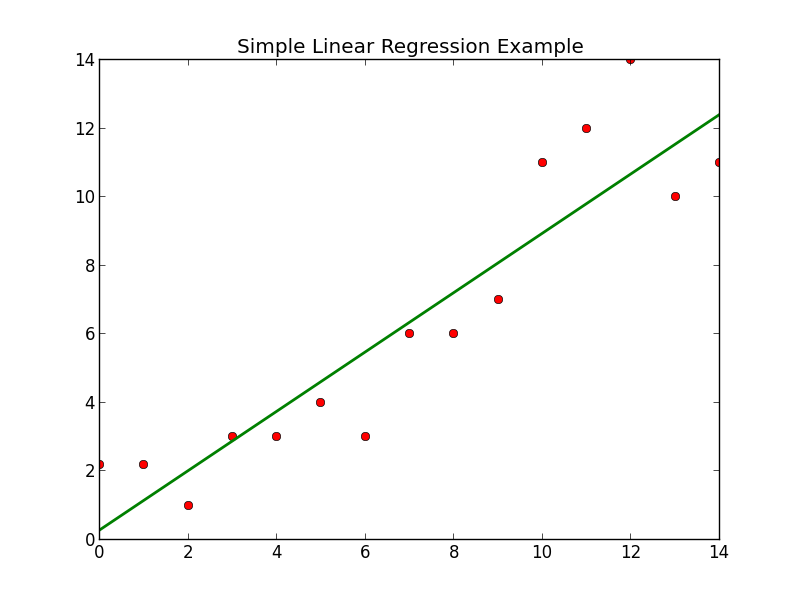
If we compare the above with the graph I previously made for the more standard method:
They are nearly identical, as expected. If you would like to test the results yourself or fiddle with the code feel free to visit my github and download/fork the code.


And which method is more precise? SVD or “standard method”
The standard approach would technically be more precise.