
In June, I made the prediction that it’s likely we’ll see hundreds of thousands dead by July from COVID-19.
According to official data, my prediction was not entirely accurate, being closer to the lower bound of my simulation(s) (a hundred thousand).
Today, we have more information about the virus and importantly improved data on death rates (via the CDC) – it appears the official death toll from COVID19 may be under reported. Perhaps more terrifying, it also appears if you are 25-85+ years old you have a 20-50% increased risk of dying in 2020 than you did in 2015-2019 (given COVID19’s current penetration rate).
Some key takeaways from this analysis:
- Official death COVID19 related deaths are likely higher than official count(s)
- Testing capacity appears to be shrinking or not being reported
- Age groups over 25 are seeing a 20-50% increased number of deaths in 2020 (over 2015-2019)
- It is likely the increased fatality rate over prior years will continue as COVID19 prevalence increases
- By year end 2020, it’s likely we will see over one million deaths in the U.S.
- By April 2021, it’s likely we will see over two million deaths in the U.S.
For transparency:
- Code (& Graphics): Github
- Data
- Covidtracking.com: https://covidtracking.com/api/states/daily
- CDC: https://www.cdc.gov/nchs/nvss/vsrr/covid19/excess_deaths.htm
- CDC data is only [mostly] accurate up to the week of July 20 – 26, 2020
COVID19 Testing Capacity
First and foremost, we aren’t testing enough to capture all cases. People are not being tested for various reasons: desire to work, no/minor symptoms, can’t receive a test, etc. Unfortunately, this will leave us vulnerable.
On a whole, the nation wide positive rate is still hovering well above lows, with around 7% tests coming back positive.
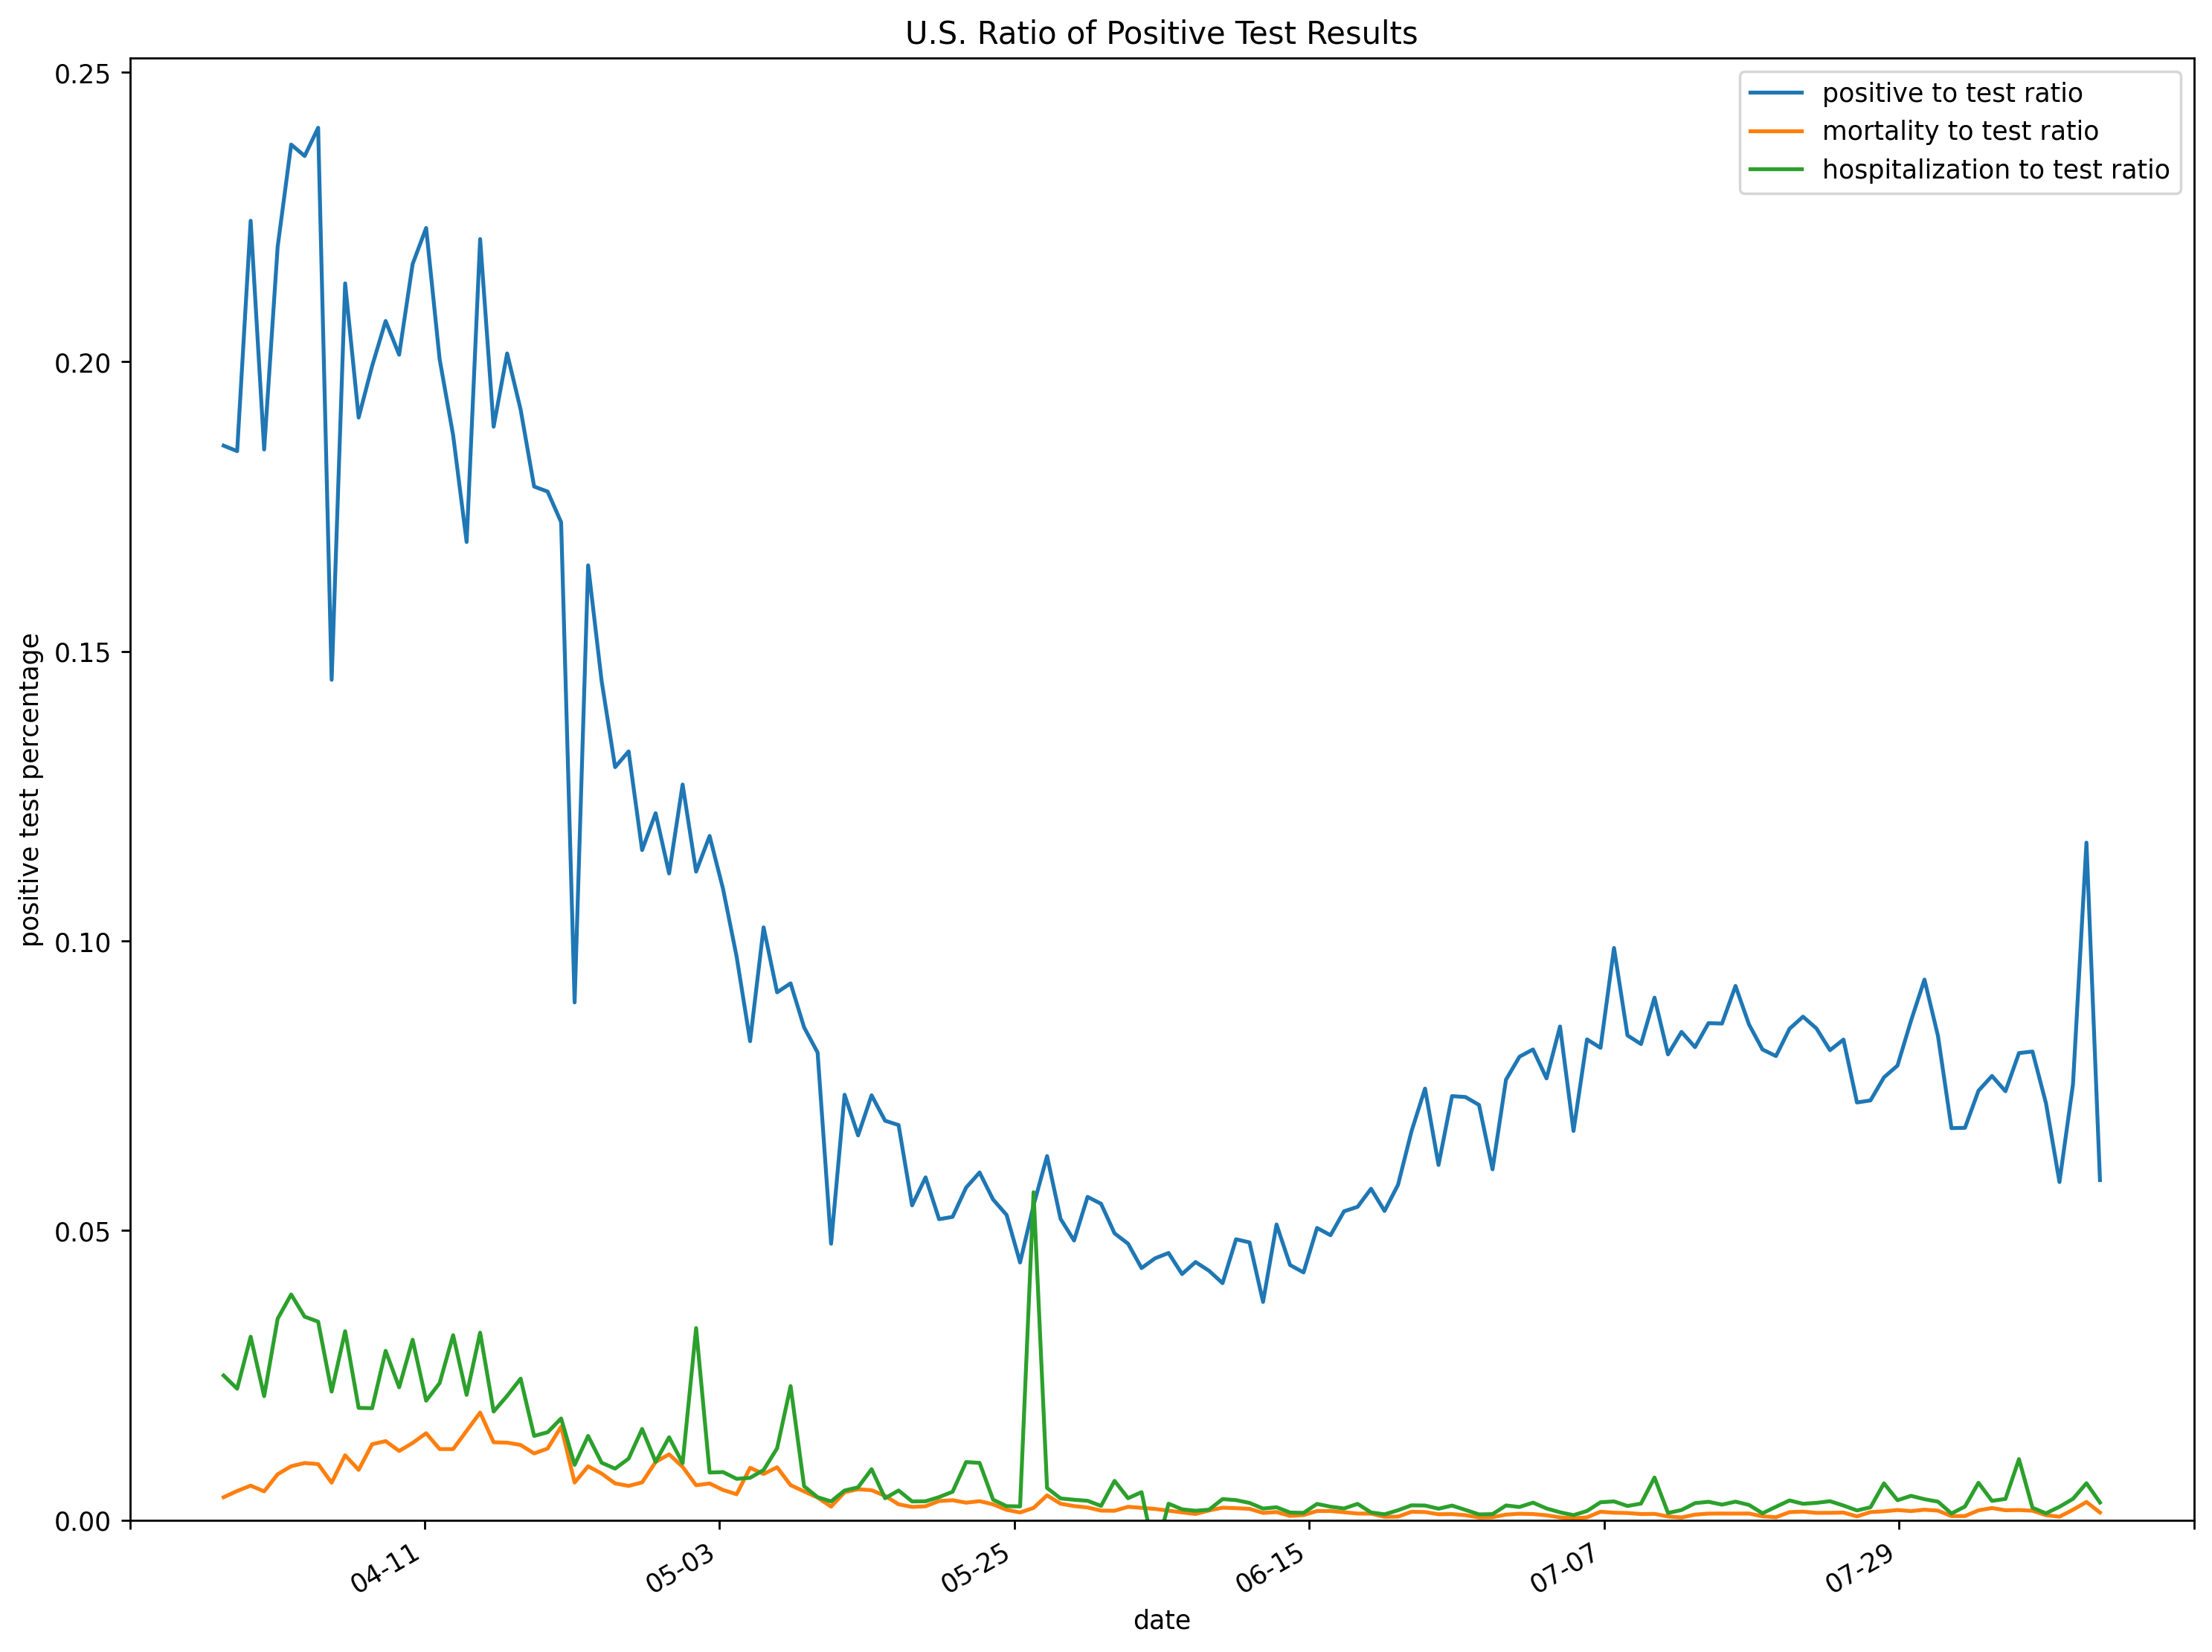
More interesting, testing capacity (or reporting) is declining:

It is not clear if the reduction in tests are from collection errors, reduced testing capacity, issues with the data provider or some other unknown factor.
Under Reporting COVID-19 Related Fatalities
Overall, our accounting of deaths from the CDC is only accurate up to the week of July 20 – 26, 2020, from week 1 to week 30 there has been 216,569 more deaths in 2020 over 2019.
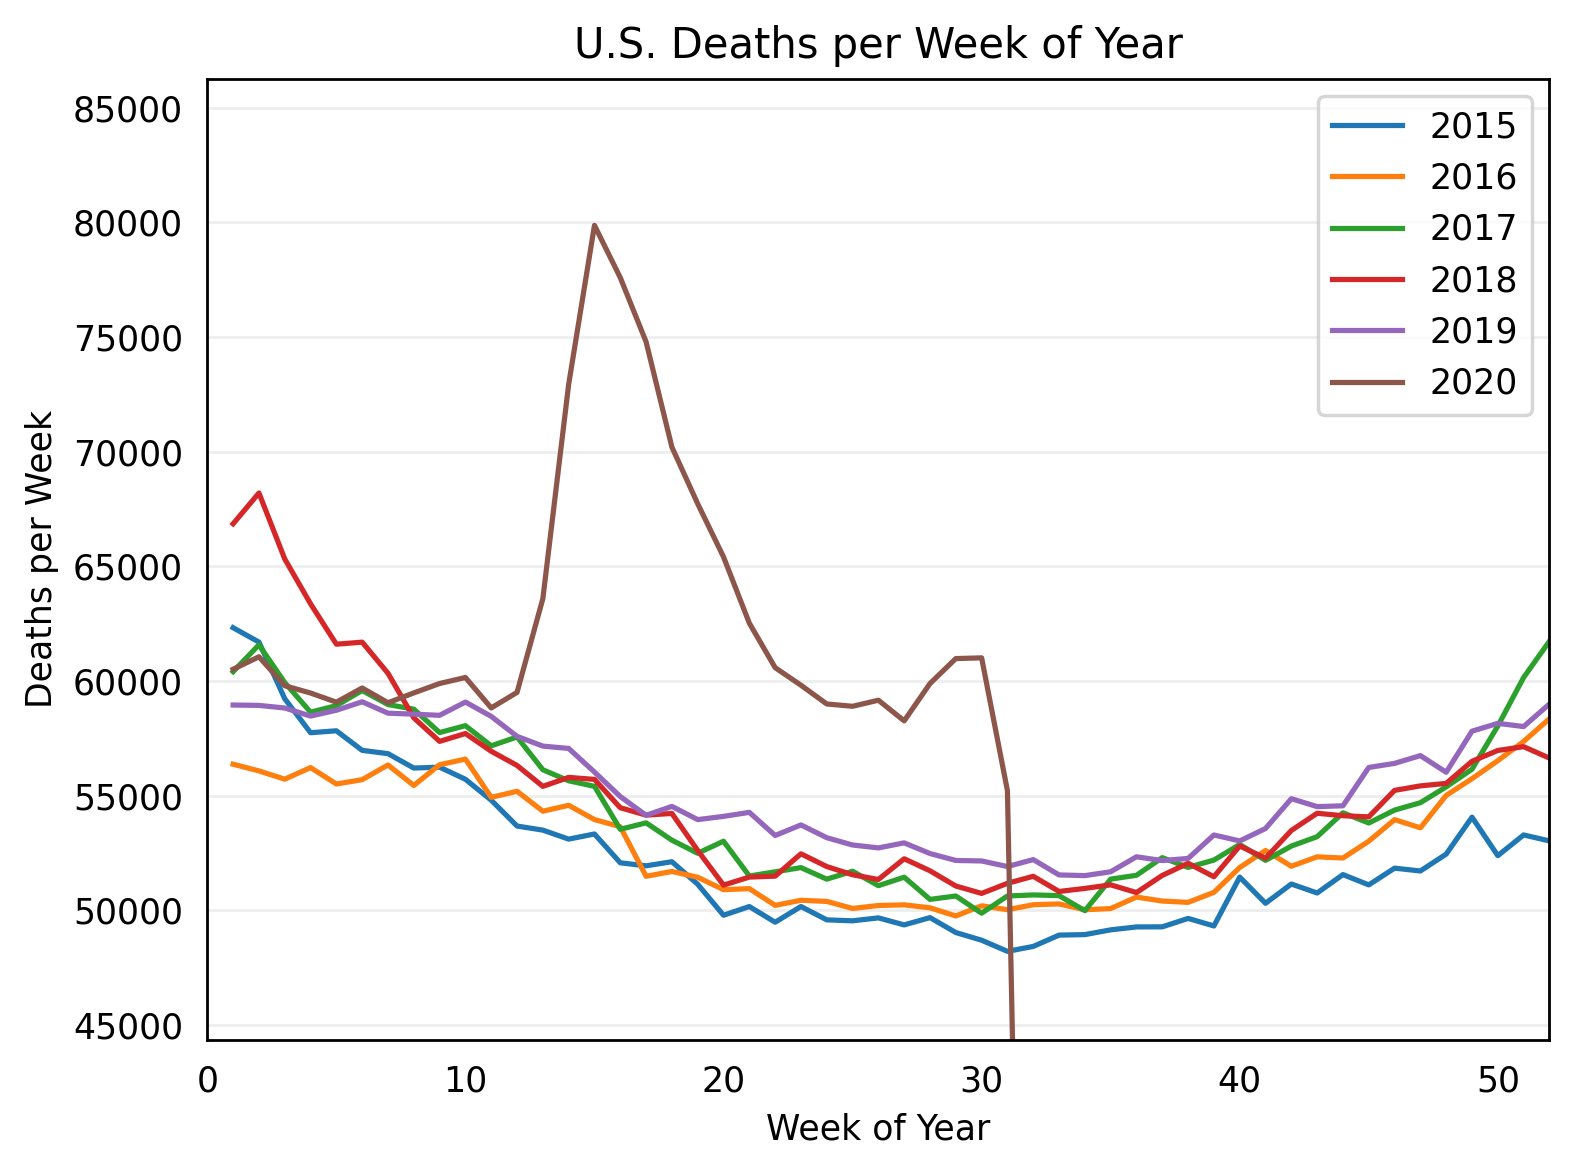
For reference, the CDC as of writing this (Aug 14, 2020) has only indicated 150k COVID19 related deaths:

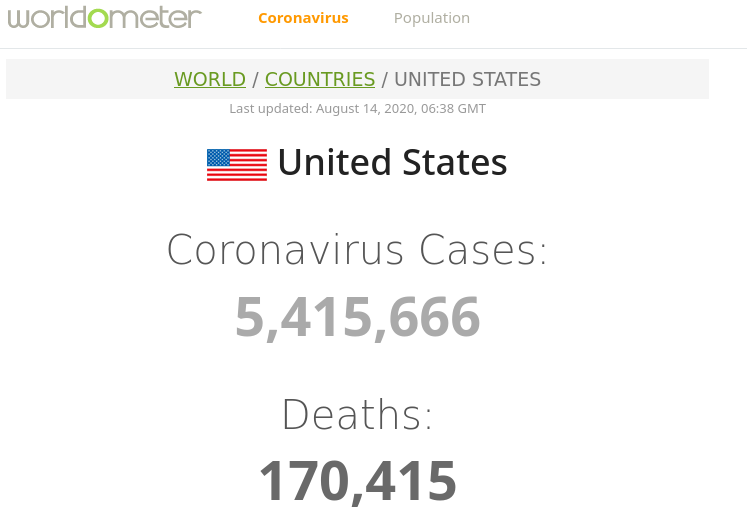
Worldometer is showing 170k deaths (on Aug 14, 2020):
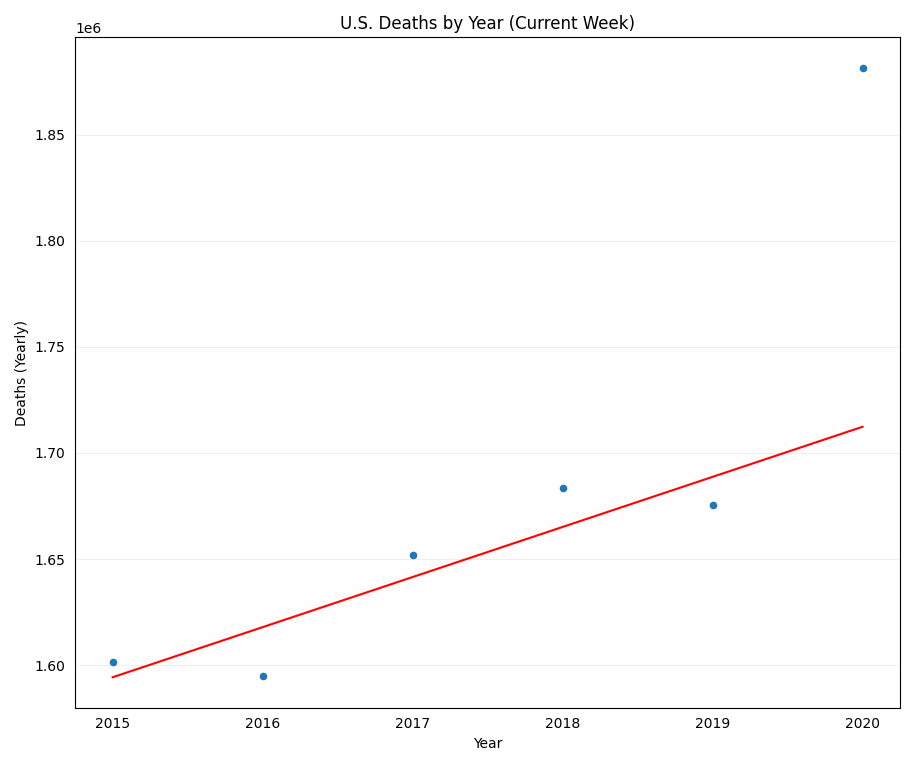
It’s important to note, that it is not an entirely fair to compare 2019 to 2020, as each year has variance in deaths. With this in mind, I also created a simple regression model, then compared the predicted death count to the actual 2020 deaths and came to figure of 178,598.40 deaths over the predicted number (remember, this is for the week of July 20, 2020):
Currently, in August — nearly three weeks passed the CDC numbers cut off and deaths are still increasing. At this point, it is likely we are well over 200,000+ deaths beyond the prediction. Further, it is quite possible we are now 250,000+ deaths above the 2019 figures. If true, we are likely under counting COVID related deaths by 40-60%.
This analysis doesn’t take into account mitigating factors (such as less car accidents) as it also doesn’t take into account confounding factors (such as more suicides).
States Under Reporting COVID-19 Related Fatalities
To highlight the clear under reporting of pandemic related fatalities, we can review states, where the issue becomes more pronounced.
Take Texas, for instance:
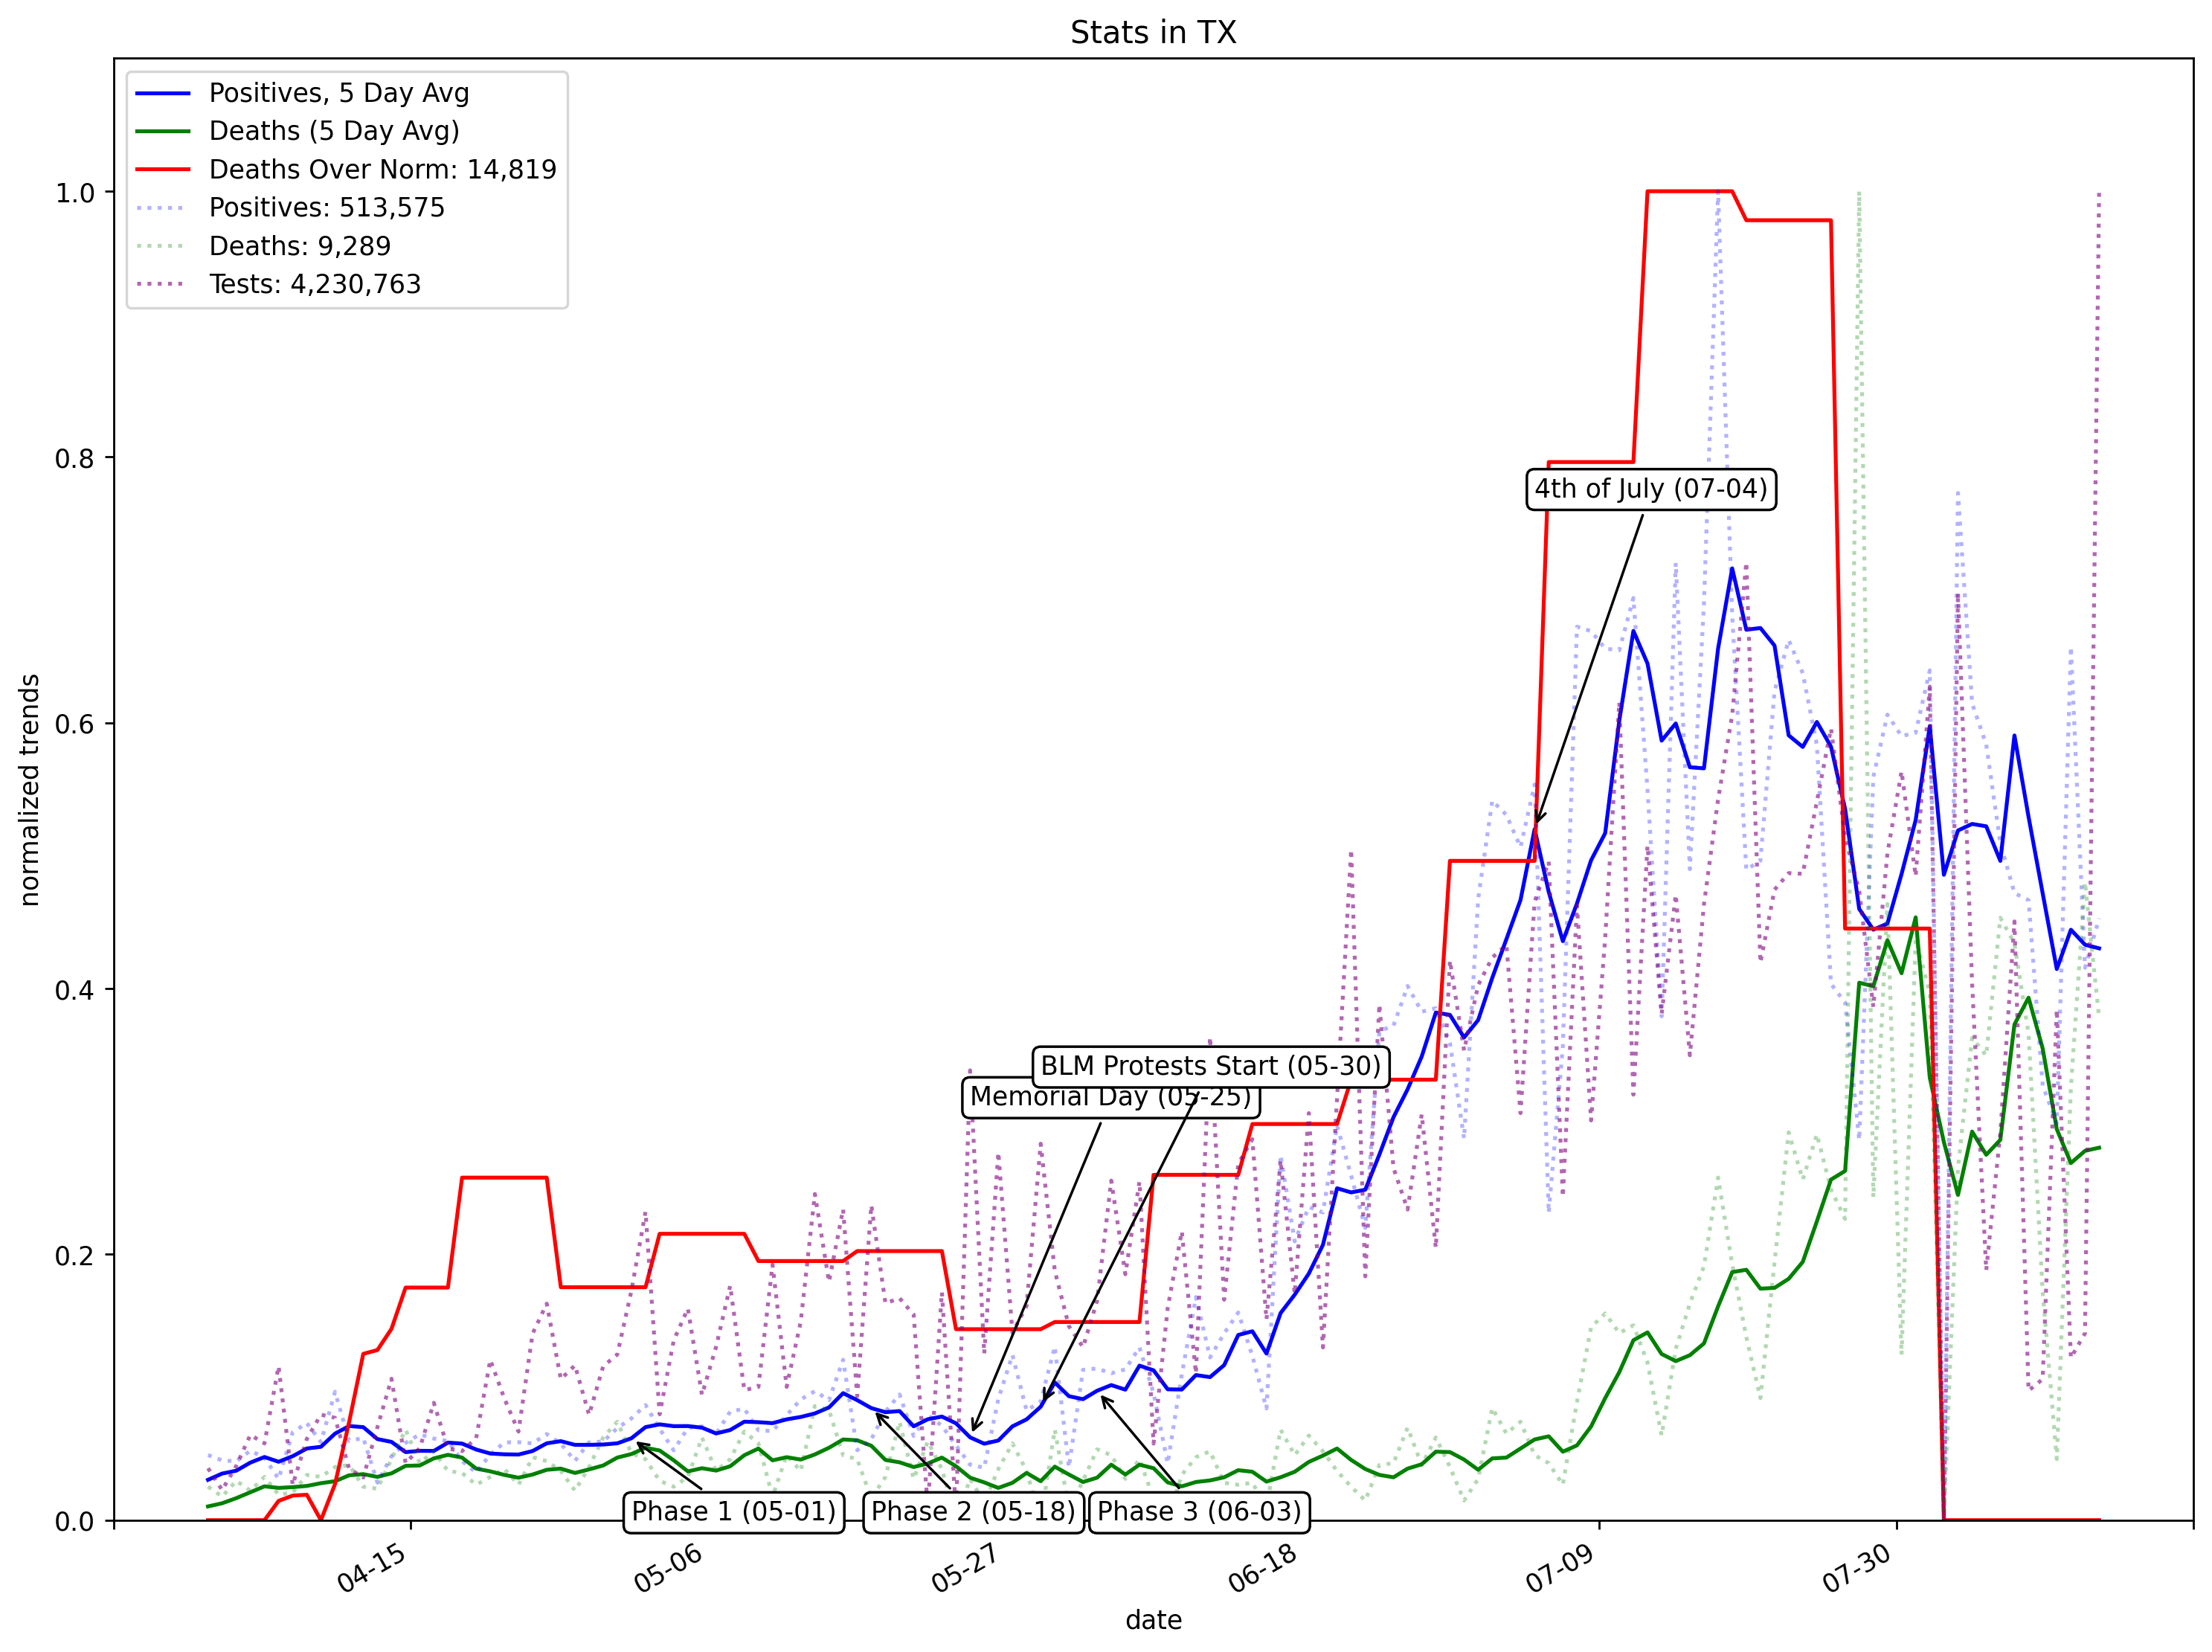 The deaths one standard deviation above the norm (norm being deaths in 2015-2019) are highly correlate with the number of new cases of COVID19, rather than that of COVID19 related deaths.
This implies one of the following:
- COVID19 deaths are being attributed to another illness
- Hospitals are focusing on the COVID19 patients and other critically ill patients are dying (at an alarming rate)
- Some other catastrophe is happening
Regardless, as more people test positive, more people are dying and there is a high correlation between the two. If I had to guess, this really means people aren’t being tested until after they are dead or critically ill & in the hospital.
Decreased Testing
It’s also important to bring attention to the decreasing number of tests from July 9, 2020 and August 13, 2020. Time will tell if the rate of fatalities will drop (or if just the COVID19 related deaths will), the decreased testing volume correlates exactly with the declining positive cases (as one would suspect).
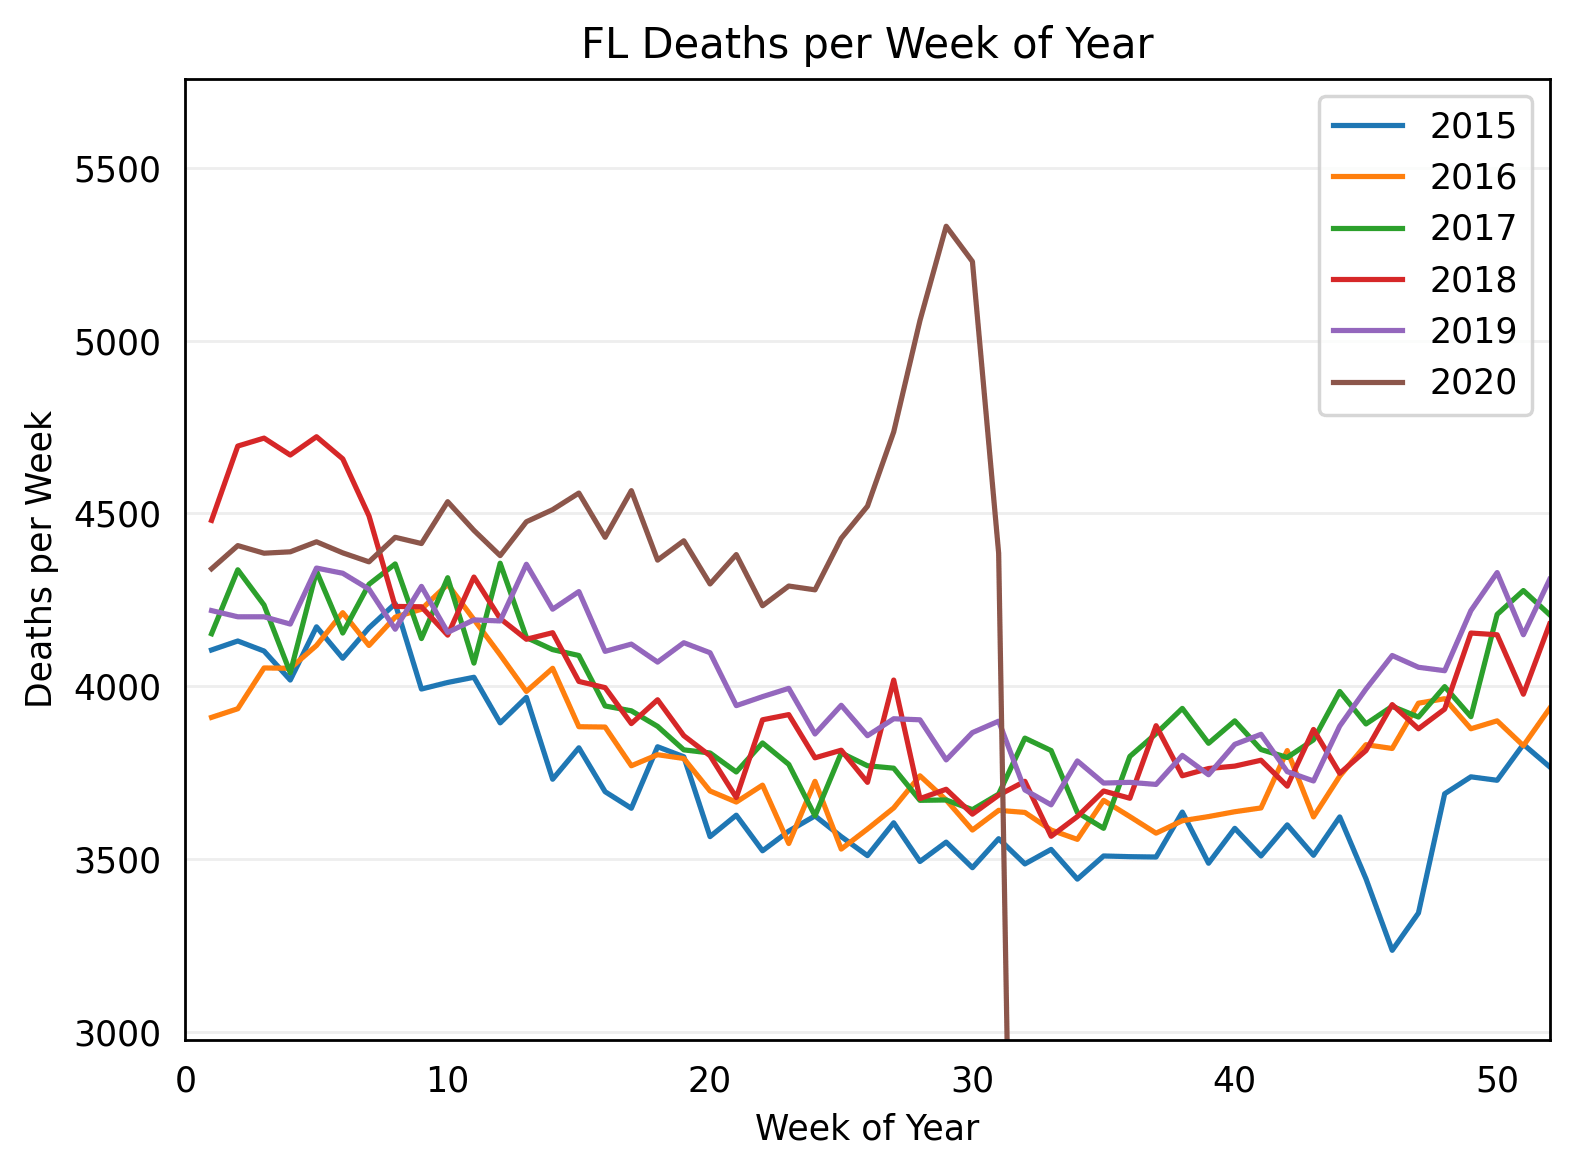
This holds true for many states, including Florida: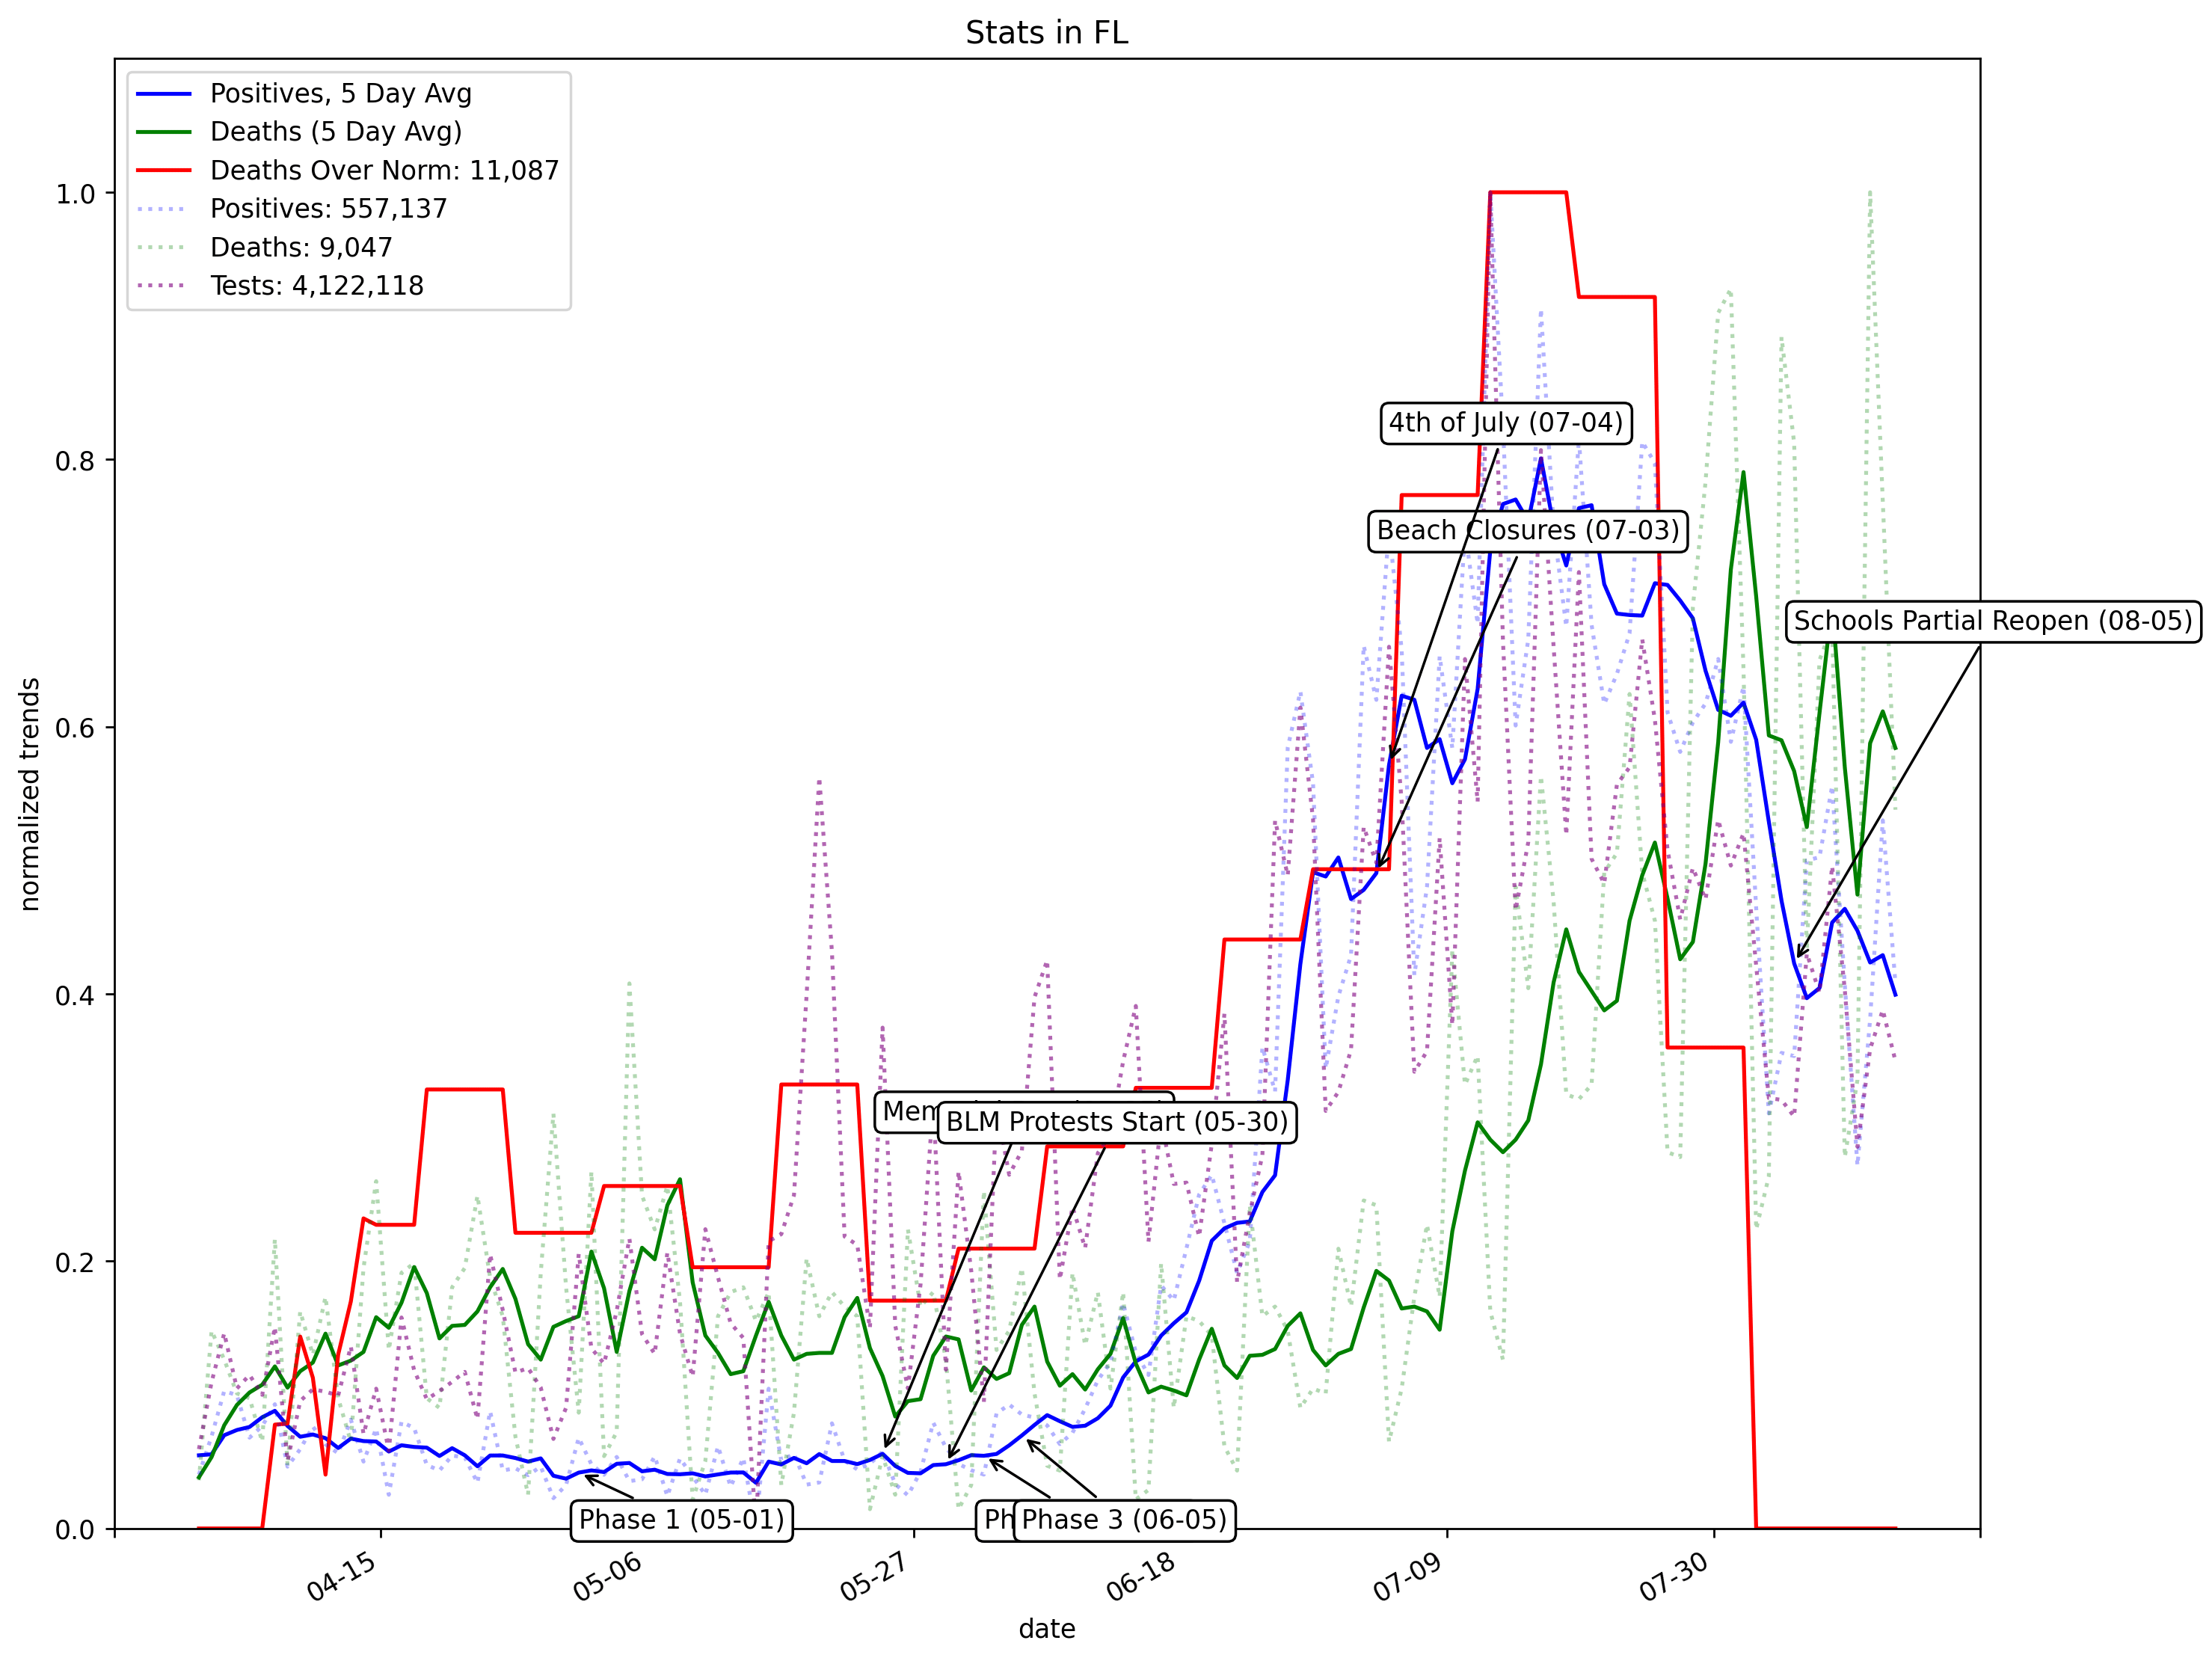 Testing capacity in Florida has dropped 40% in the past six weeks. At the same time, the death toll is rising. Frankly, I wouldn’t be surprised if reduced testing was a ploy related to opening schools.
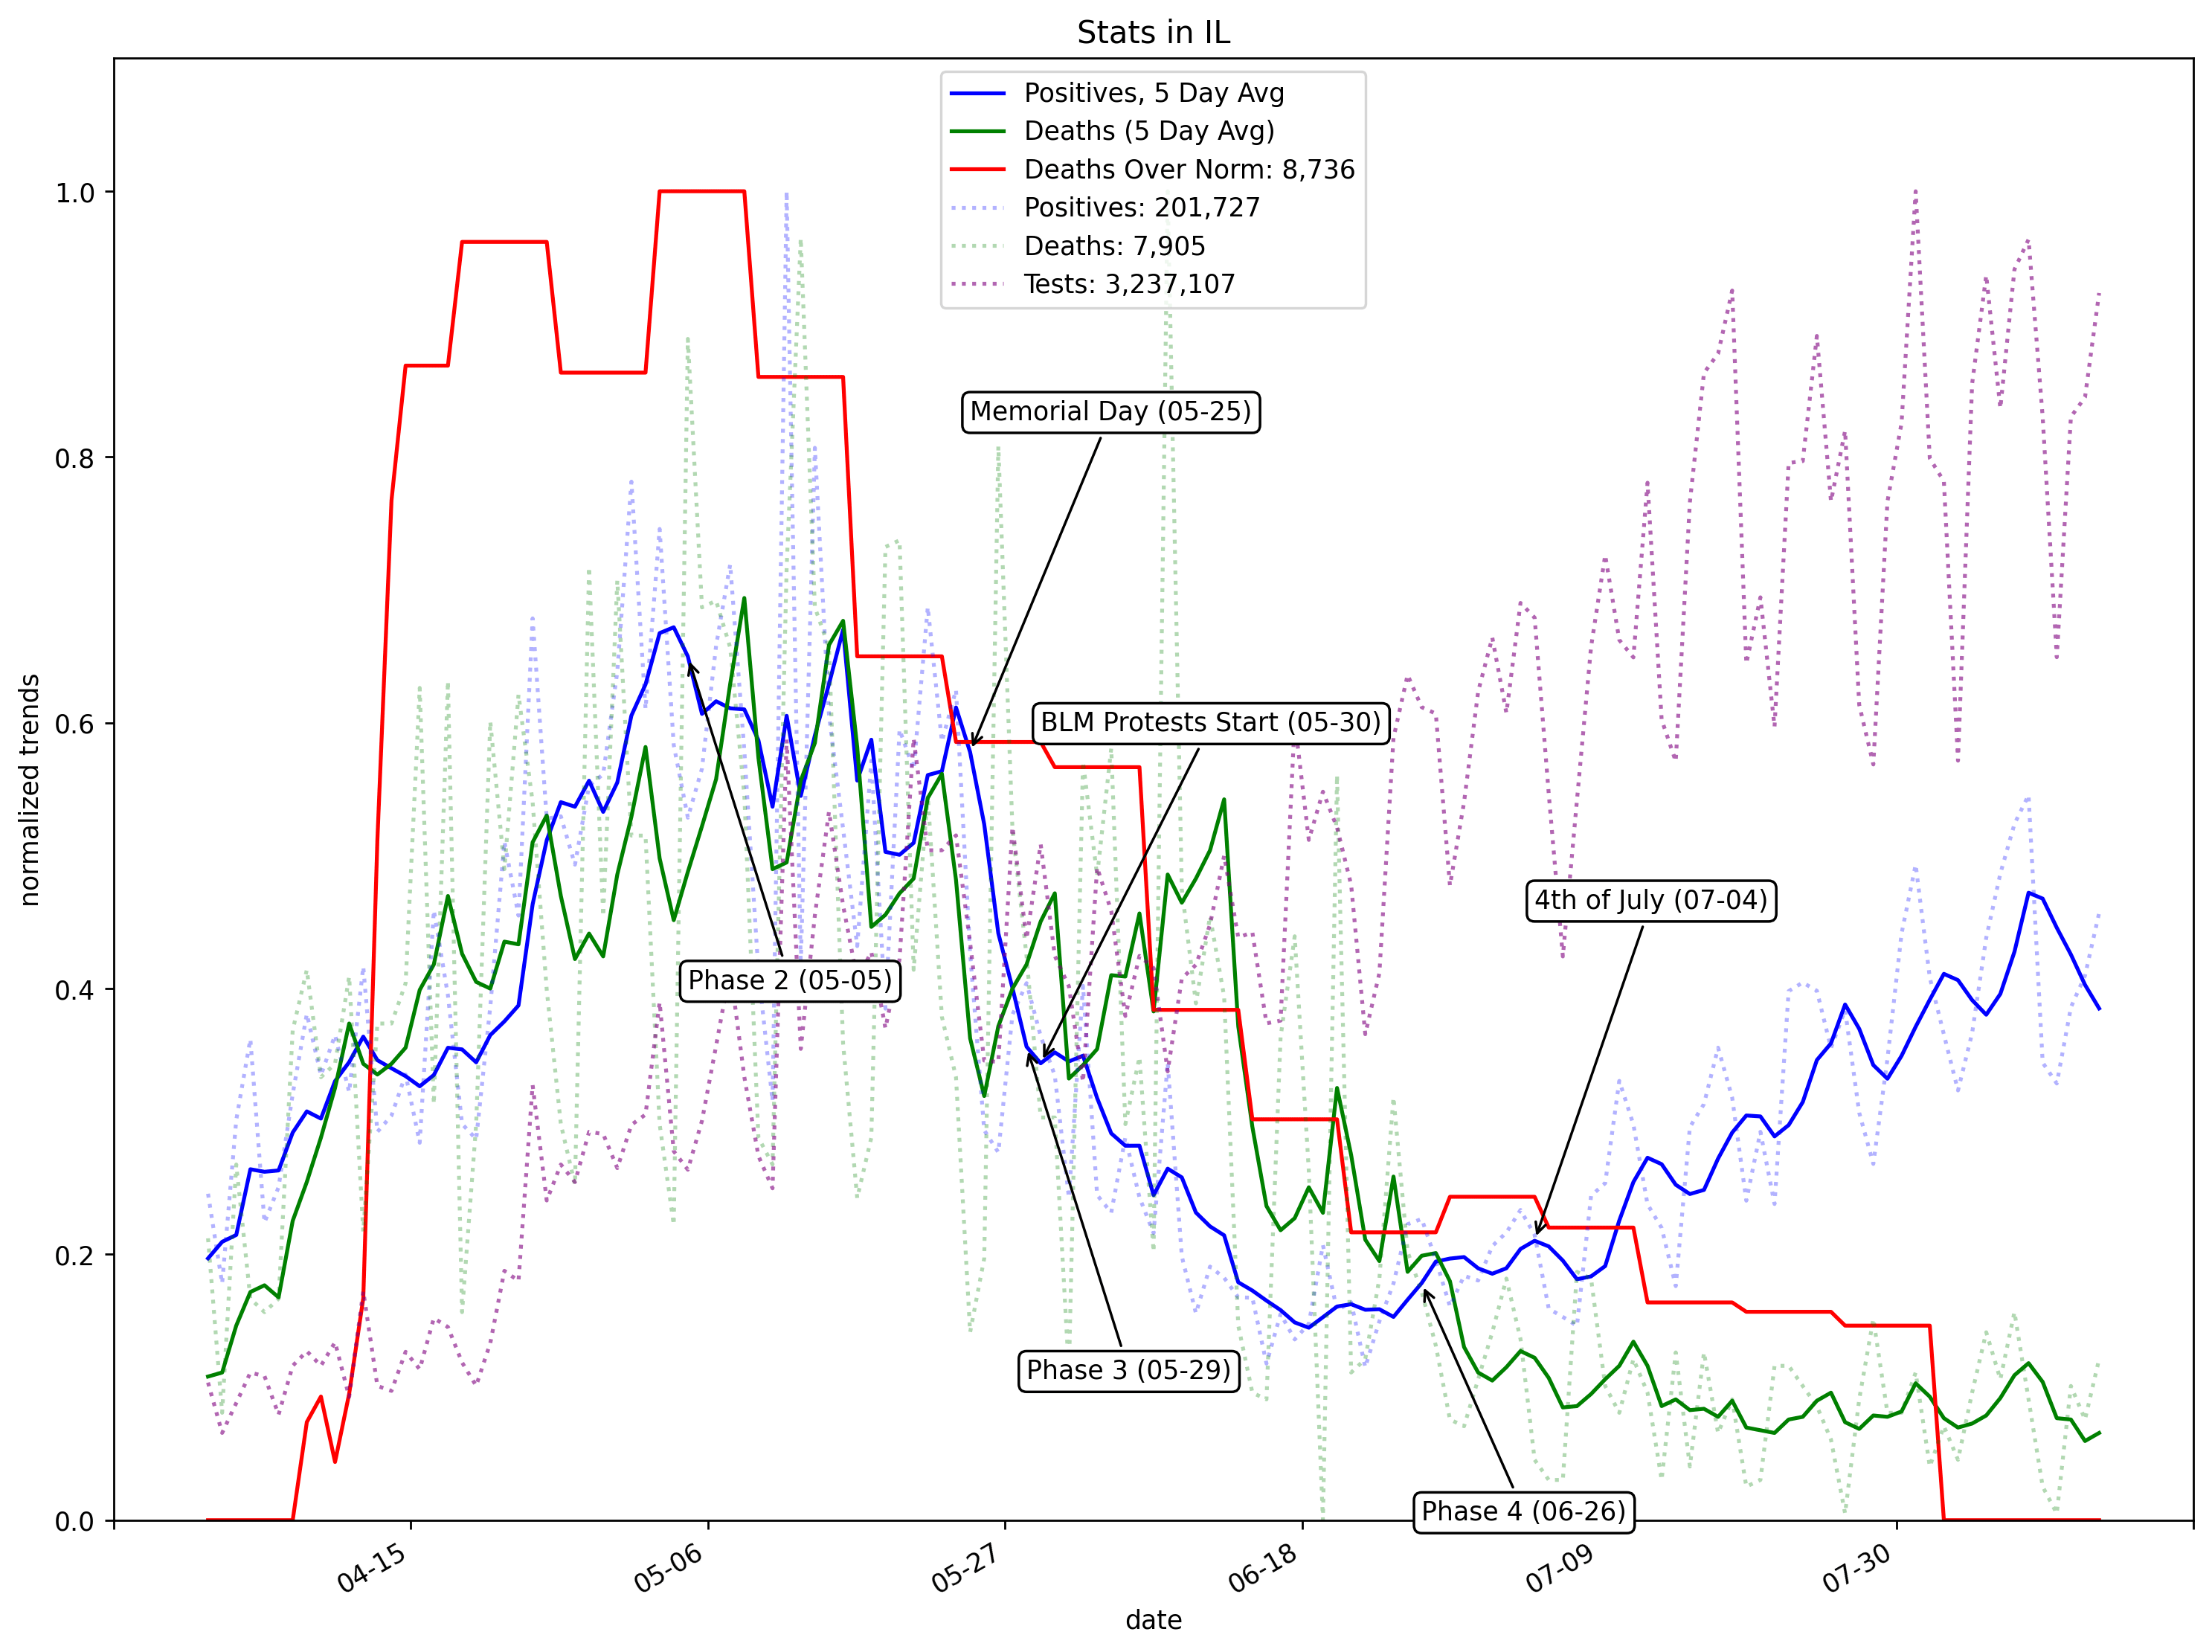
There are some examples where the figures do appear to be generally accurate, such as New York: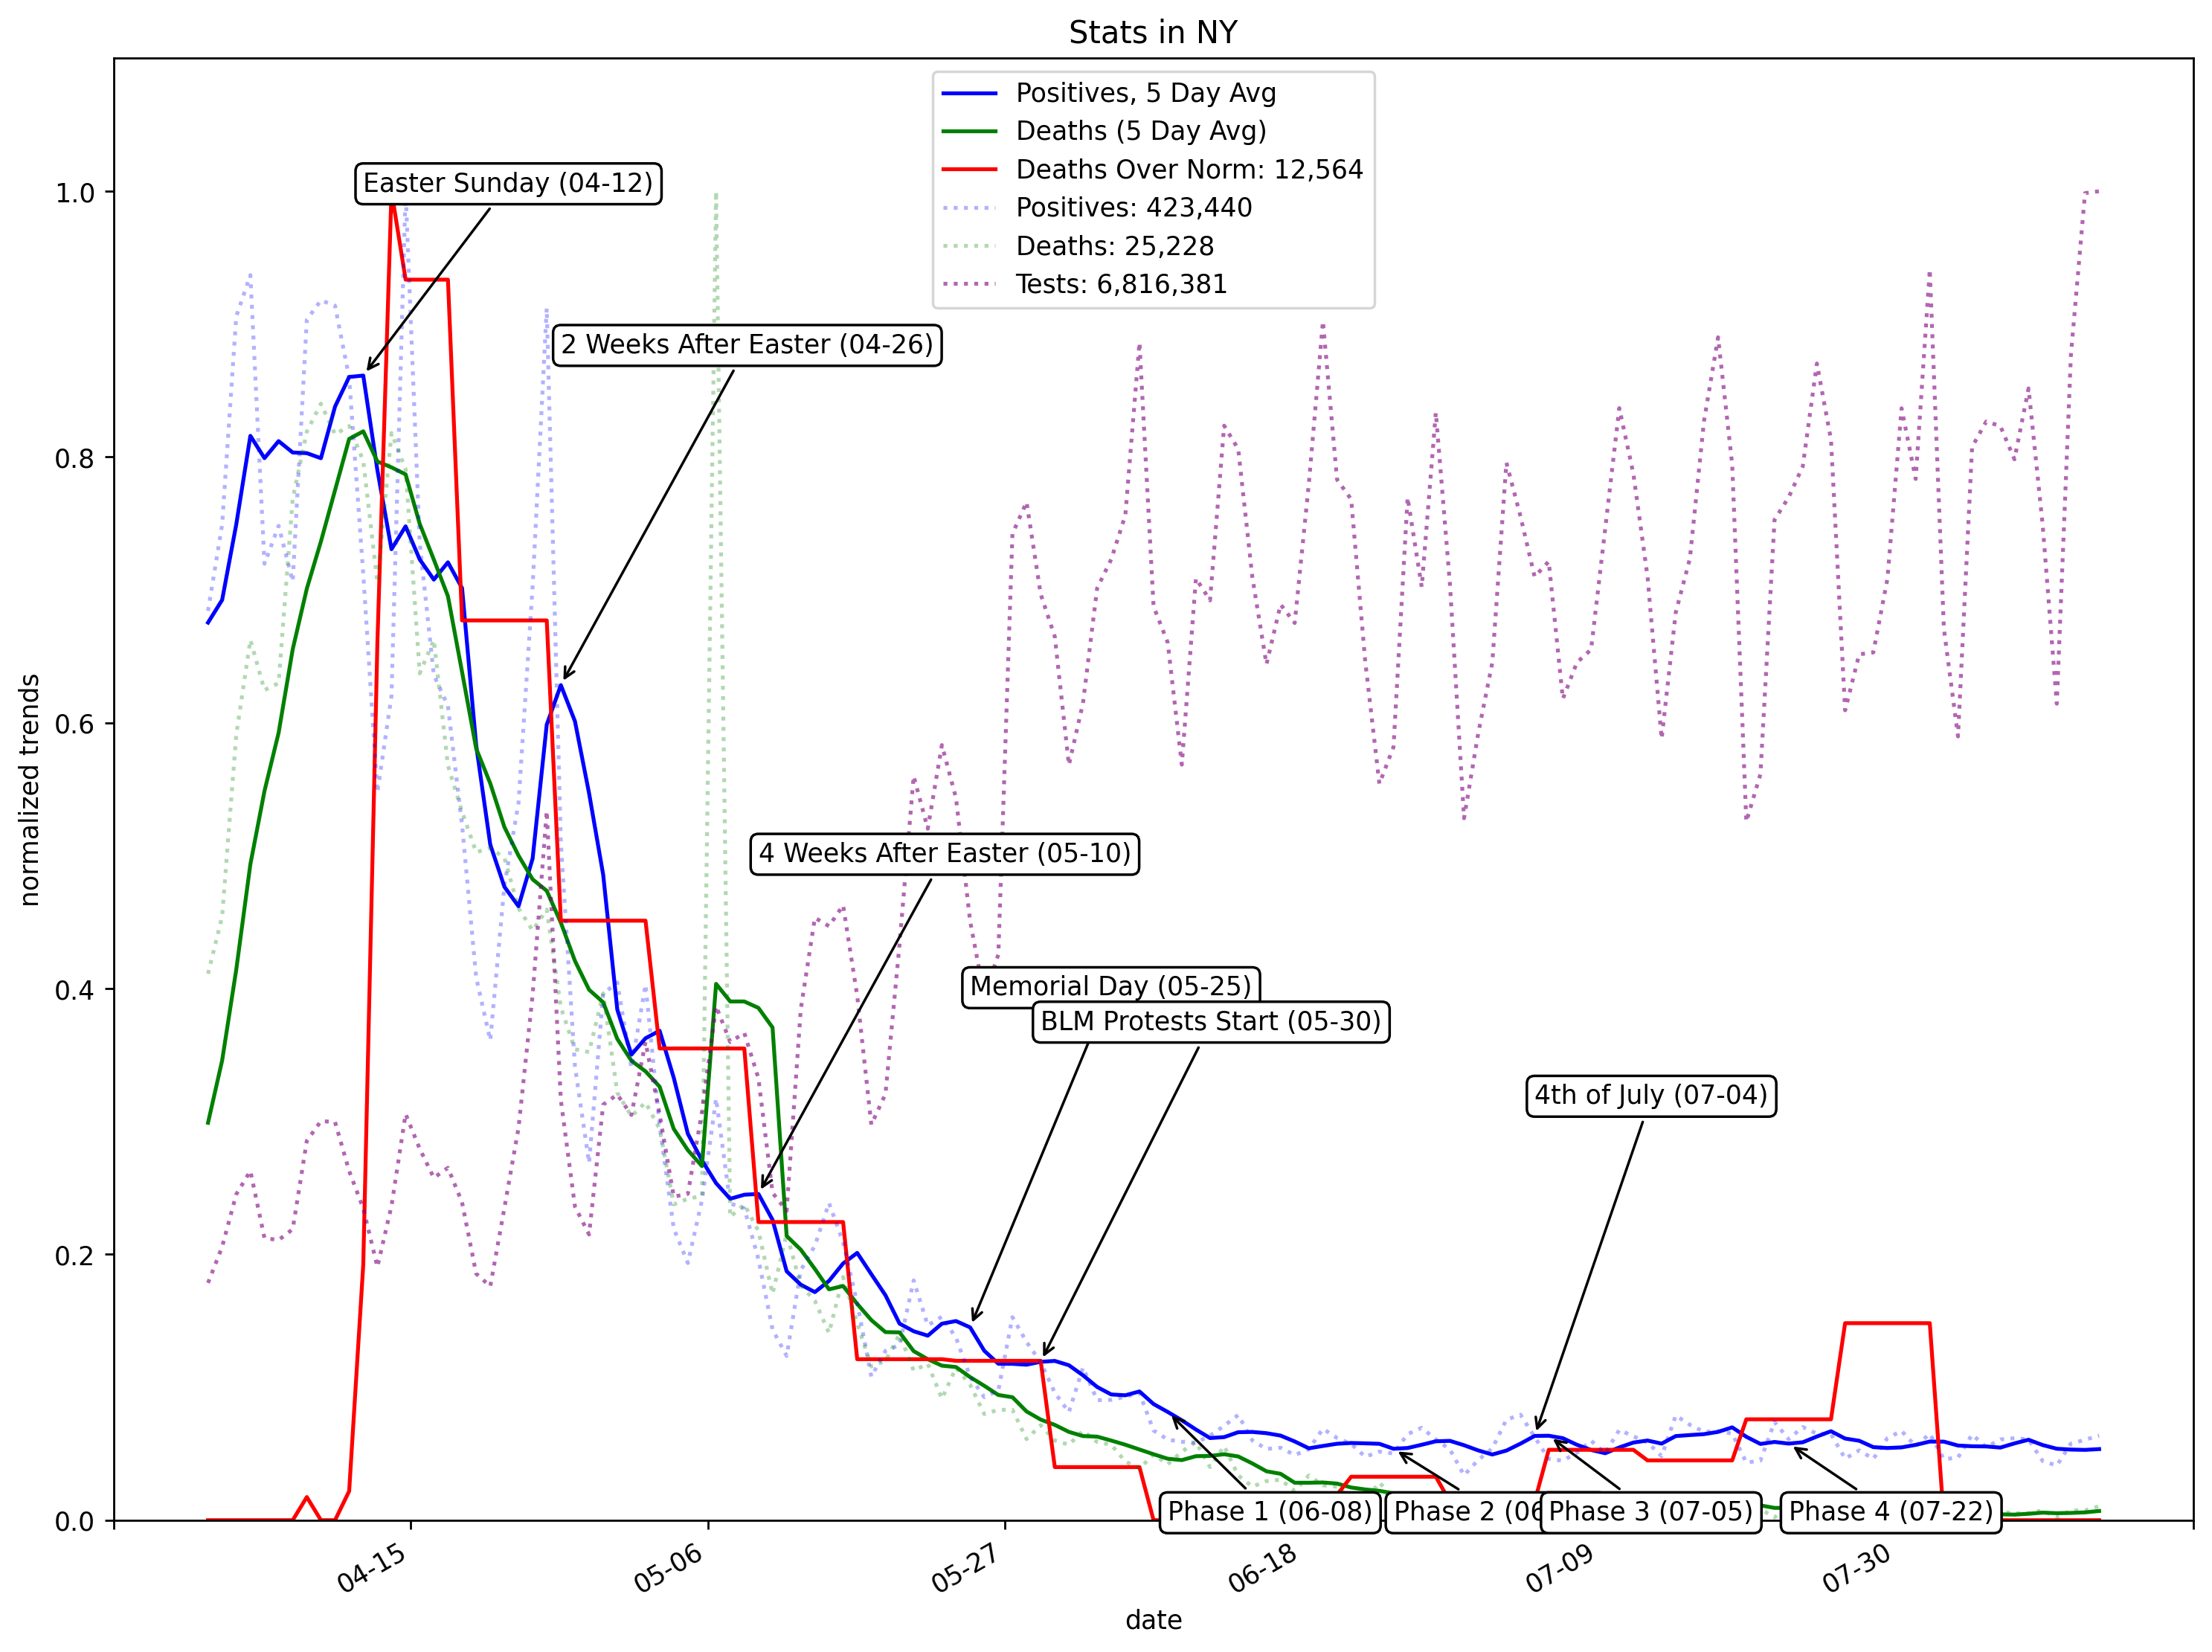 Another example is Illinois (although initially there was likely under-reporting due to lack of testing):
 In terms of which states are more prone to under-reporting vs others, there doesn’t appear to be a clear pattern. Under-reporting appears to be a signal that there is not enough testing – aka the system is overwhelmed. This makes logical sense, as the system becomes overwhelmed, resources are diverted on saving lives over identifying community spread. There’s also a question if the test results are being reported federally and outside my dataset for some reason.
Risk of Dying in 2020
It is difficult mid-pandemic with a lack of testing to determine the case fatality rate (CFR) or mortality rate, which is typically what is being reported. Unfortunately, we don’t know the infection rate. With that in mind, it’s probably more accurate to track the “increased risk of dying in 2020”.
In other words:
How much greater are my risks of dying in 2020 over 2019?
Infection rate is included as part of metric, we don’t know the extent. COVID19 penetration is maybe 10% across the U.S. population (studies vary wildly). Regardless, as the year progresses, we are sure this number will increase.
With that in mind, on average all age groups over 25, are seeing roughly 10-15% increased risk of dying in 2020 over 2019 (again, this will likely increase):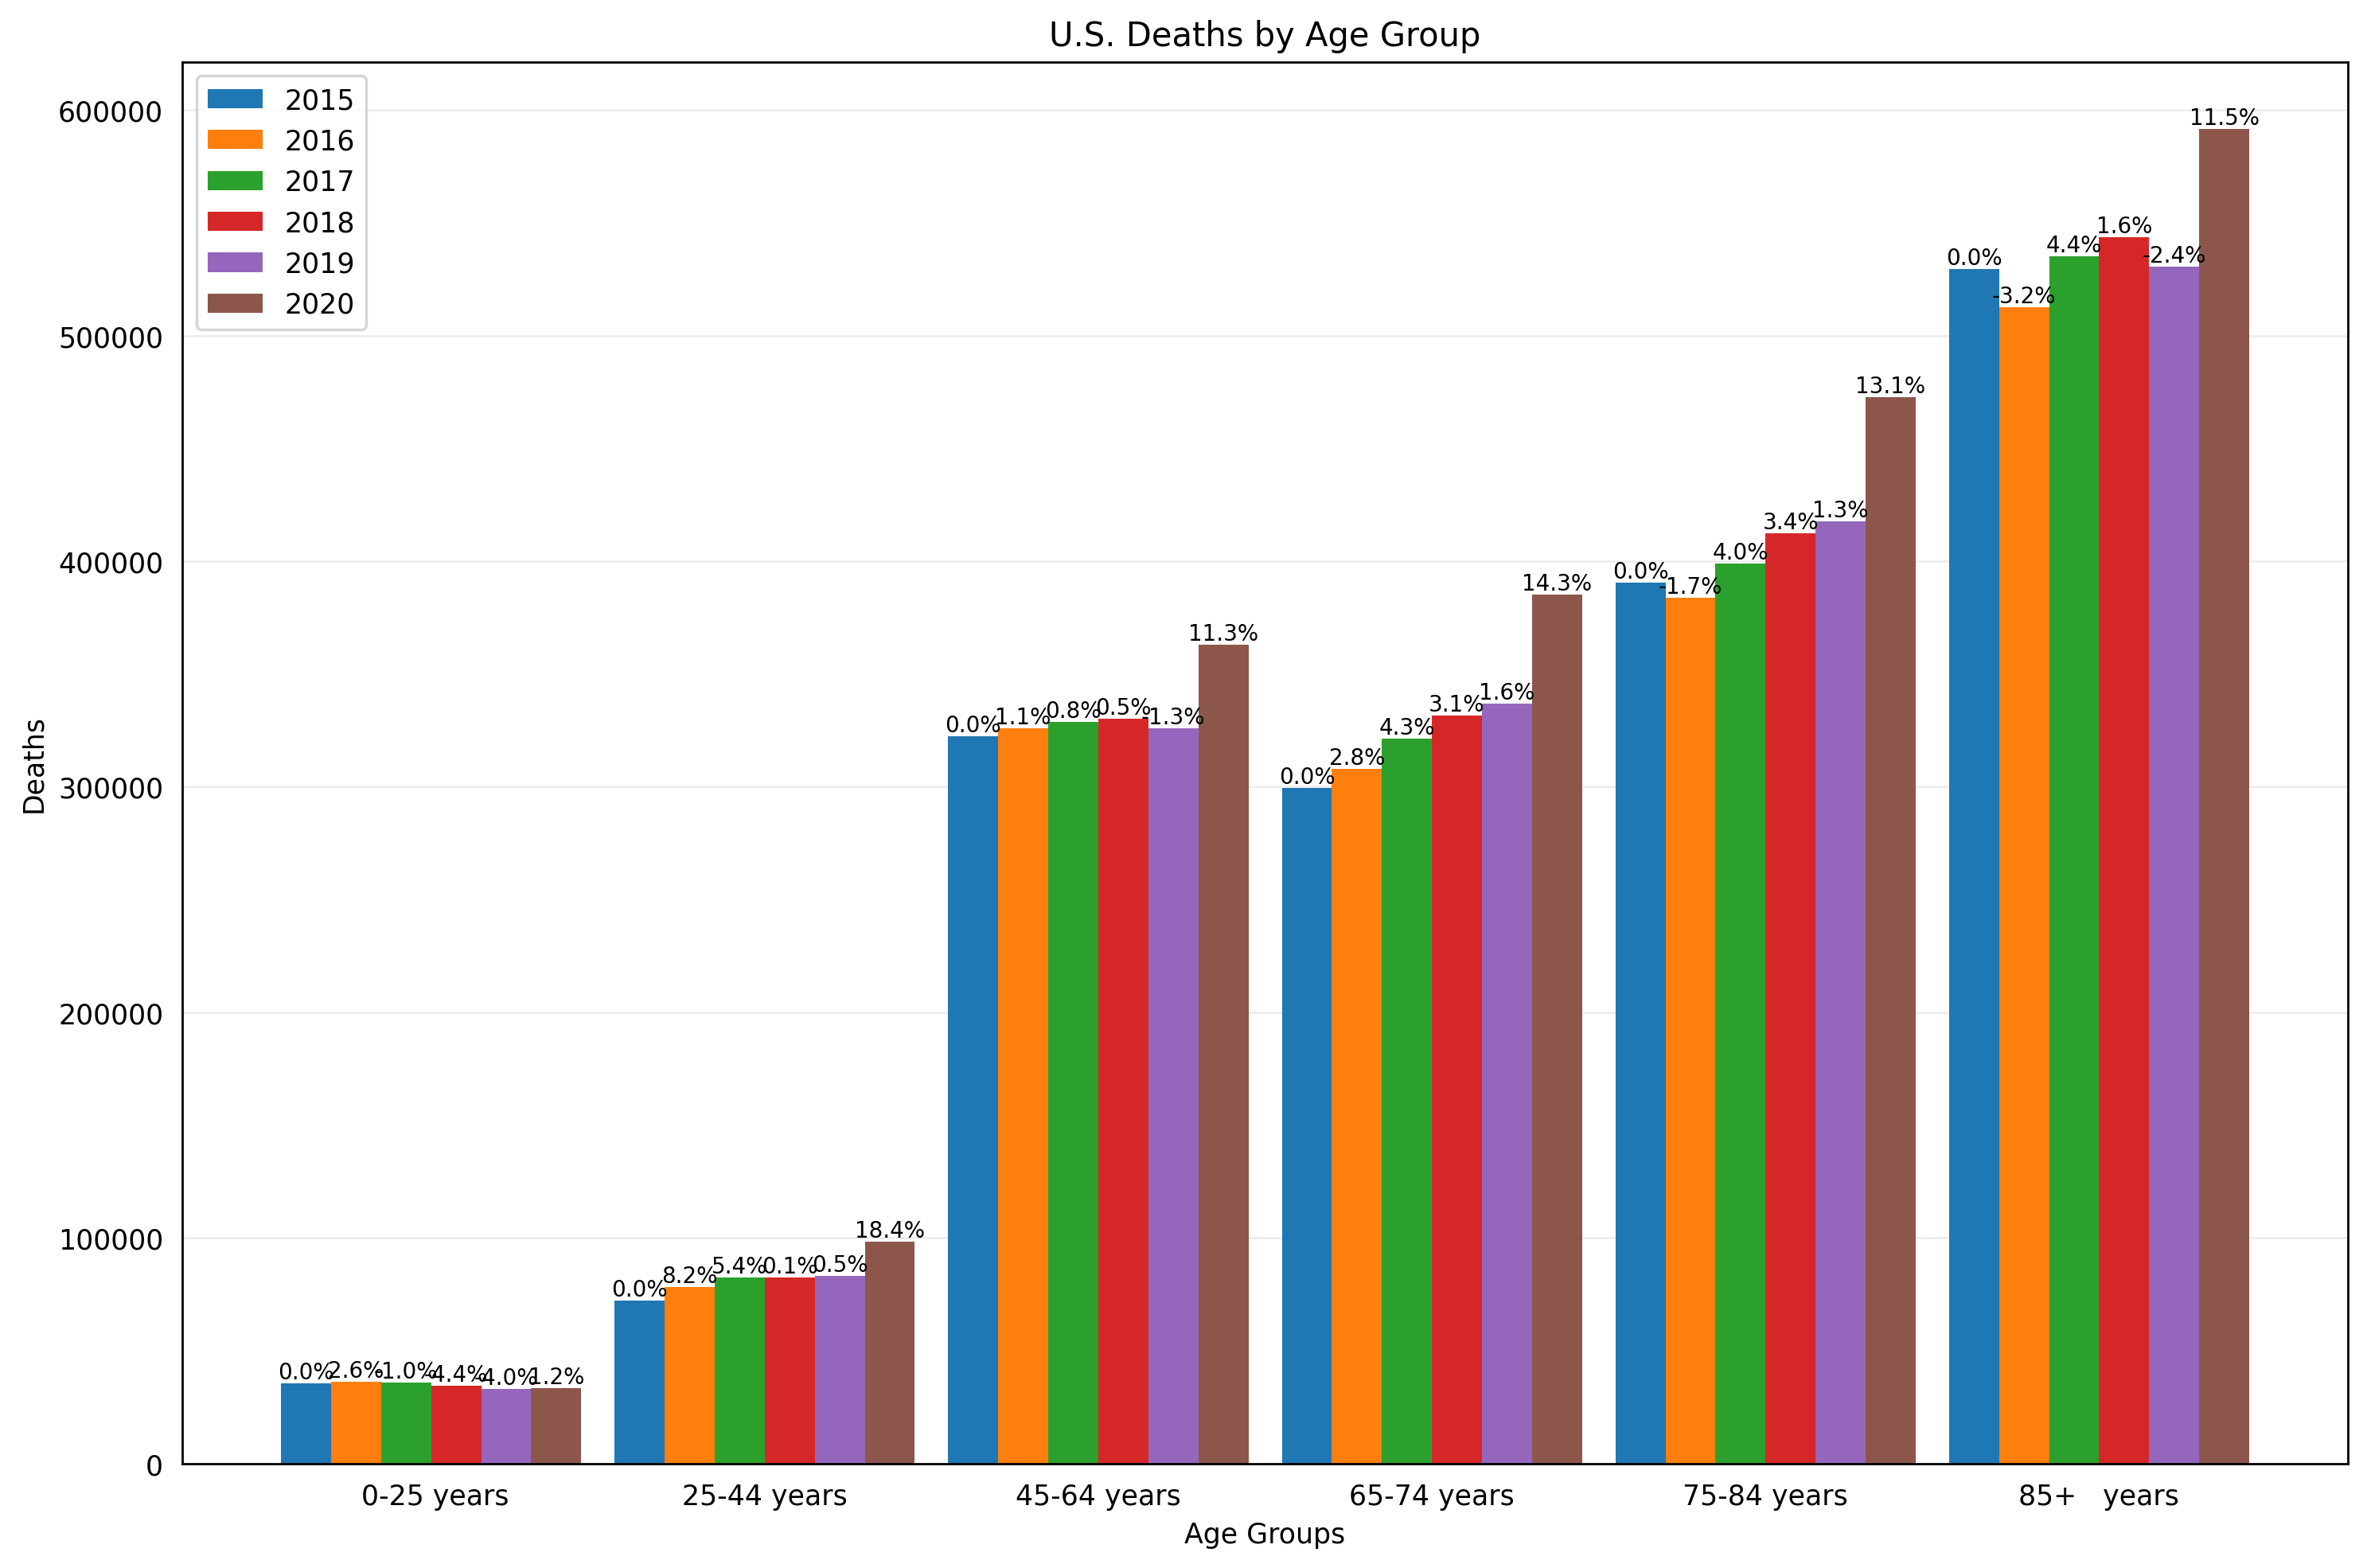 Focusing on New York, which appears to have kept decent records & has a decent infection rate – the data looks stark:
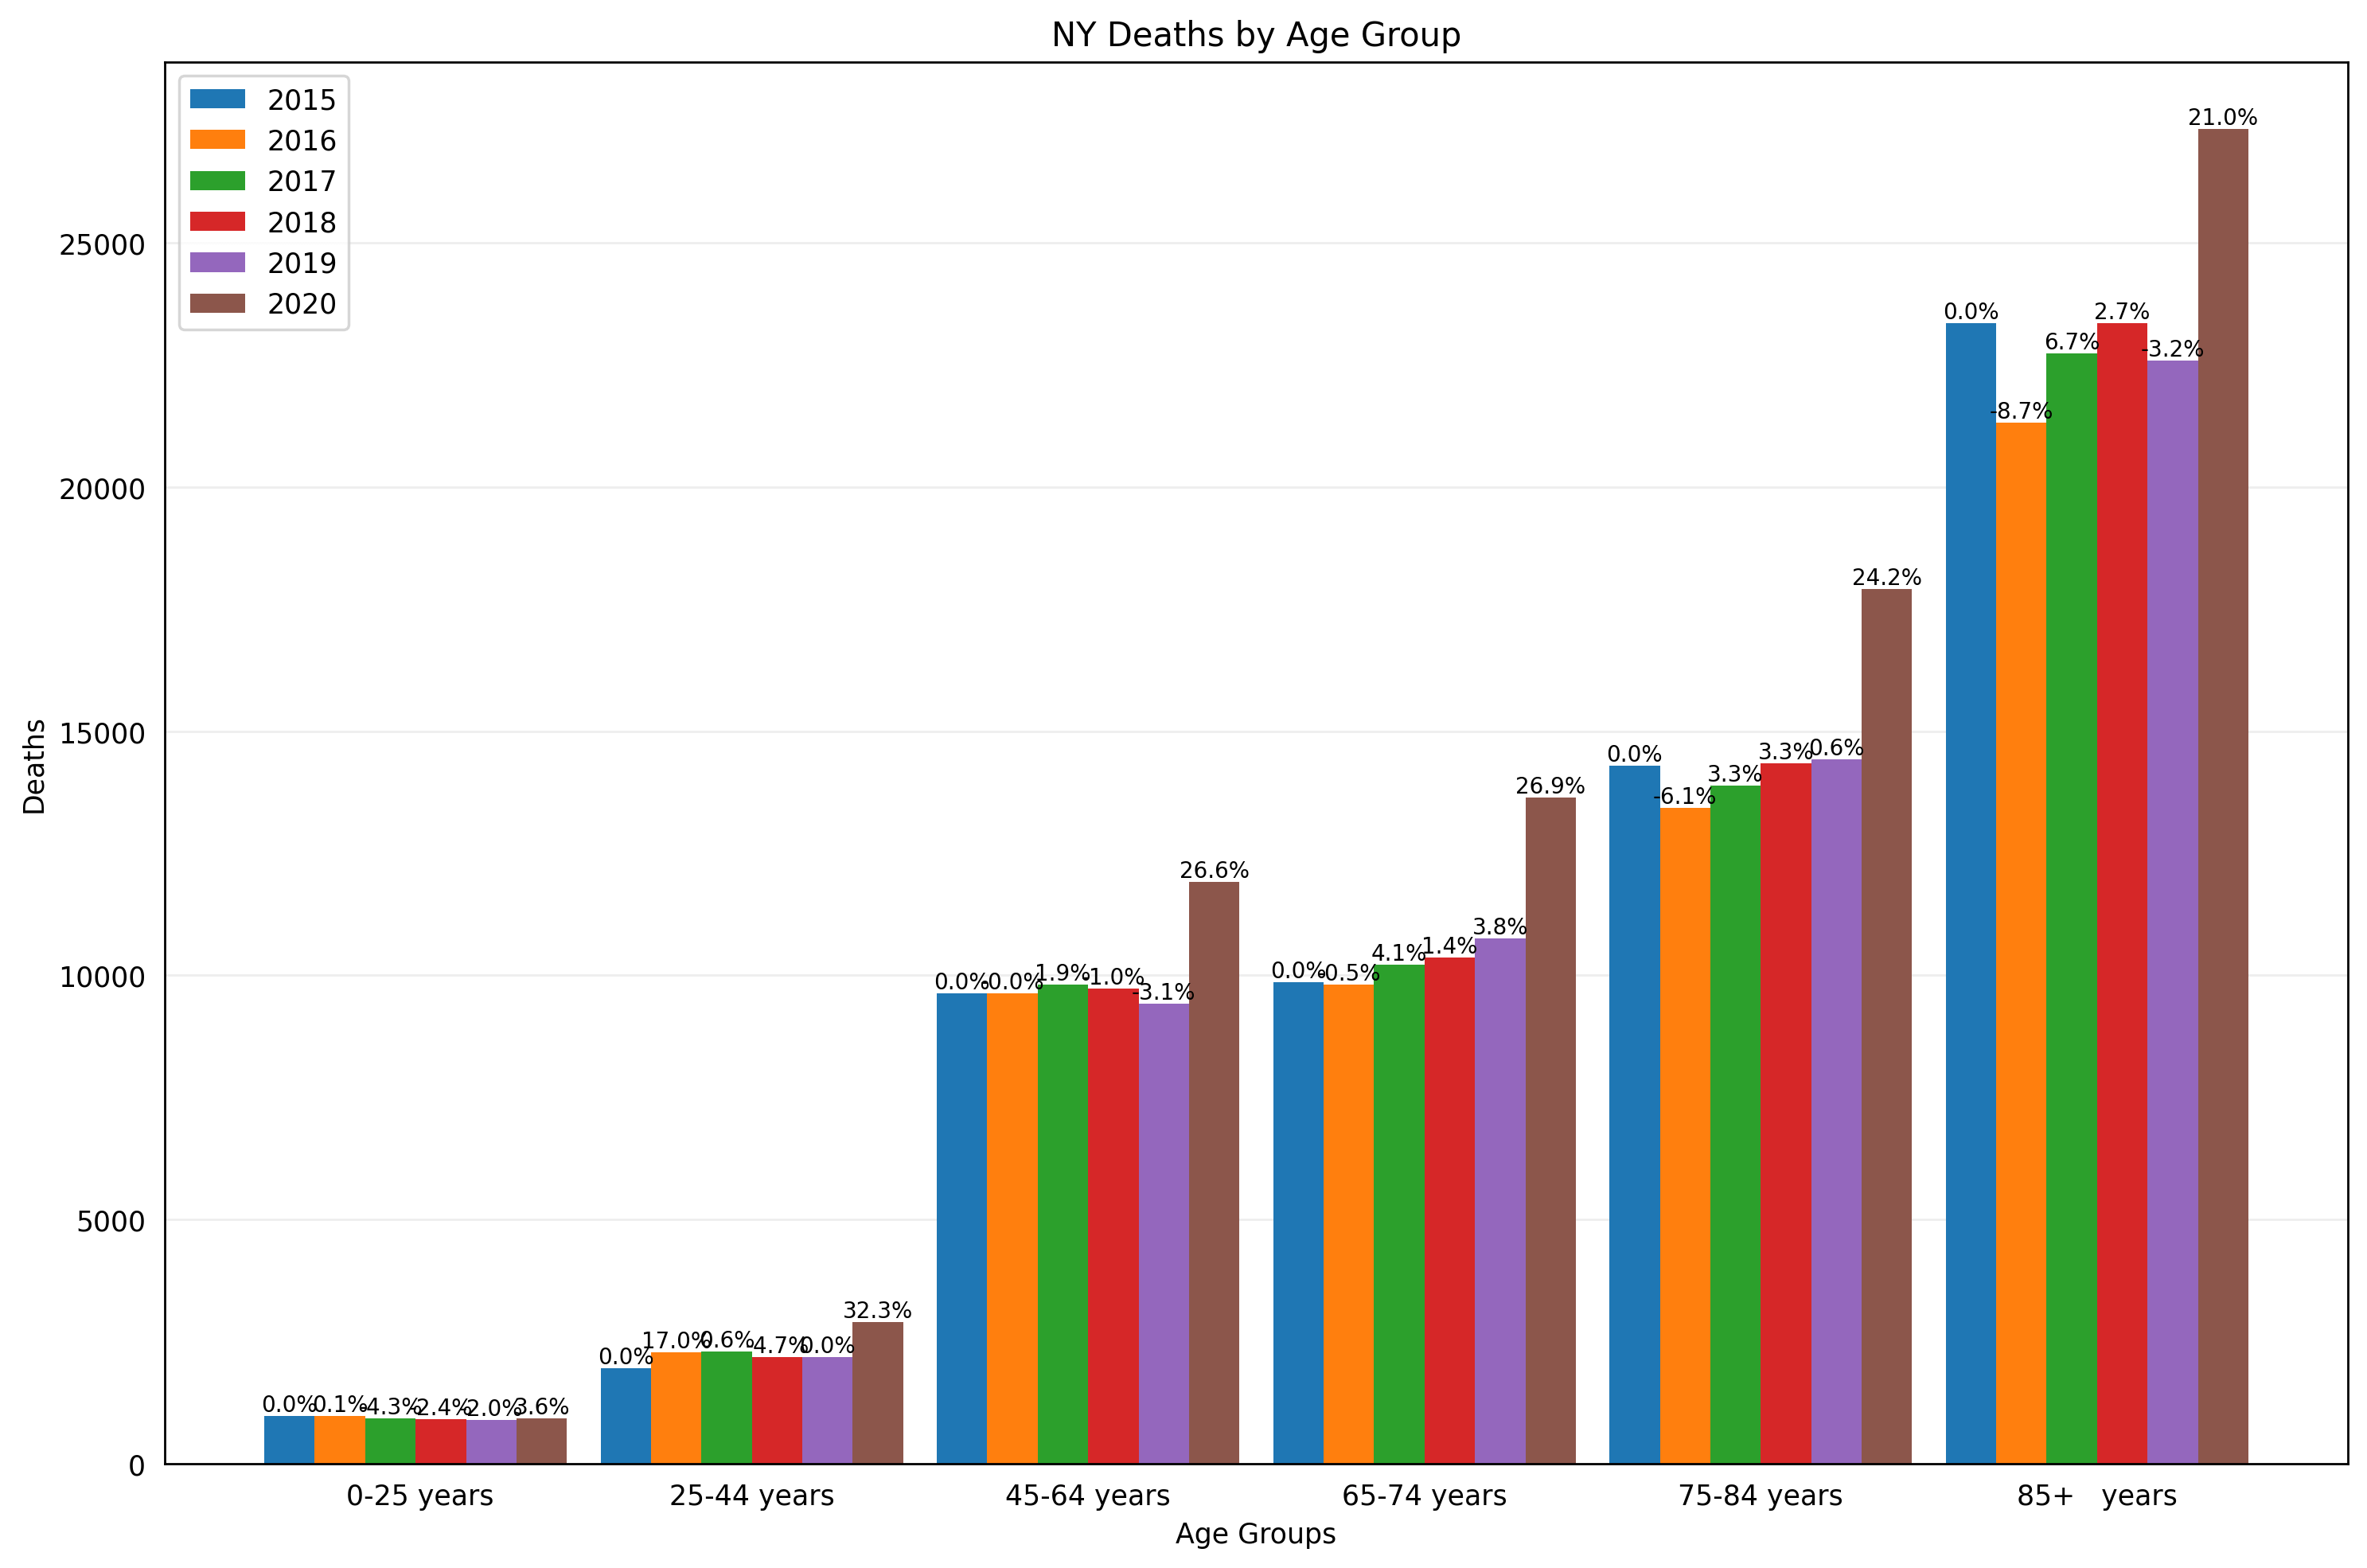 New Yorkers have a 25-30% increased risk of death for everyone over the age of 25.
It’s been estimated that >20% of New Yorkers have been infected by the virus[1]. While the exact infection rate is debatable, it’s clear these numbers will increase.
New Jersey which saw a similar situation to New York has seen close to a 30-50% increased risk of dying in 2020 over prior years:
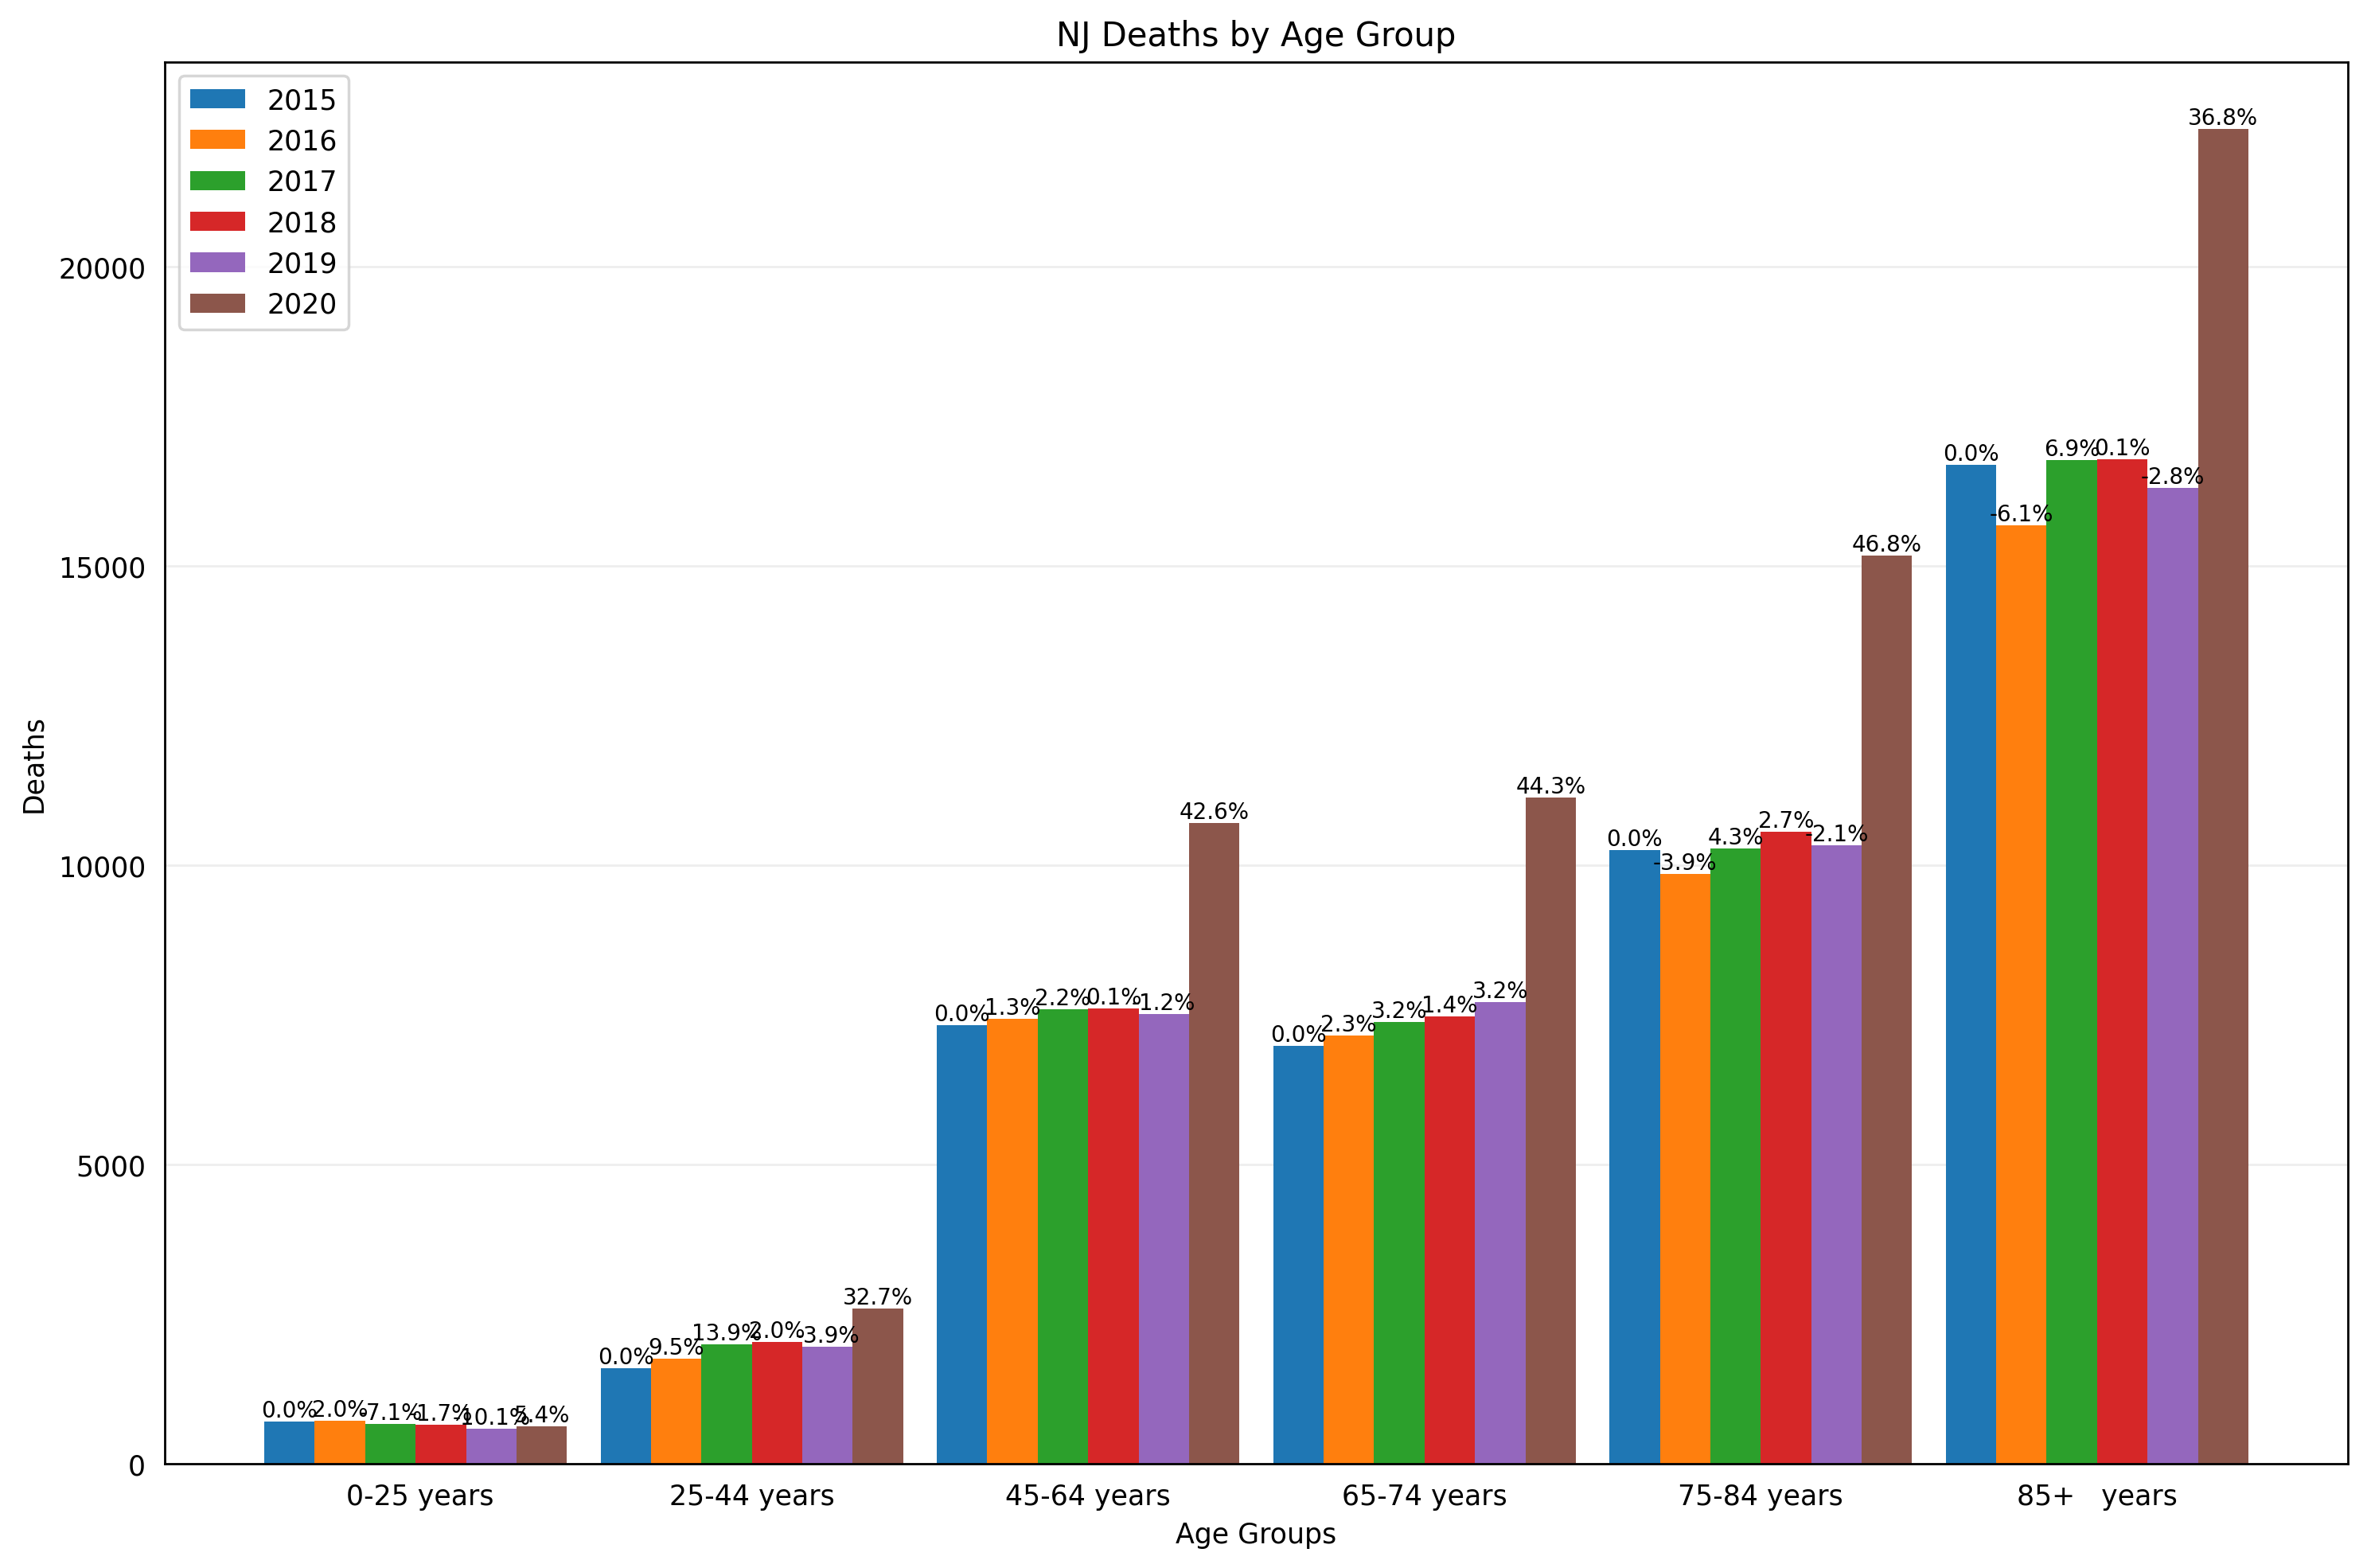 Presumably, this would imply more of the population has come into contact with COVID19.
In contrast, Illinois is seeing less deaths over the norm, particularly in the older age groups : The difference in Illinois appears to be older populations have seen a muted increase in deaths. Arguably, this can be attributed to better nursing home isolation and the stricter lock down conditions.
It should be noted, Texas on the other hand has seen a muted increase in fatalities in all age groups (less than Illinois or New York):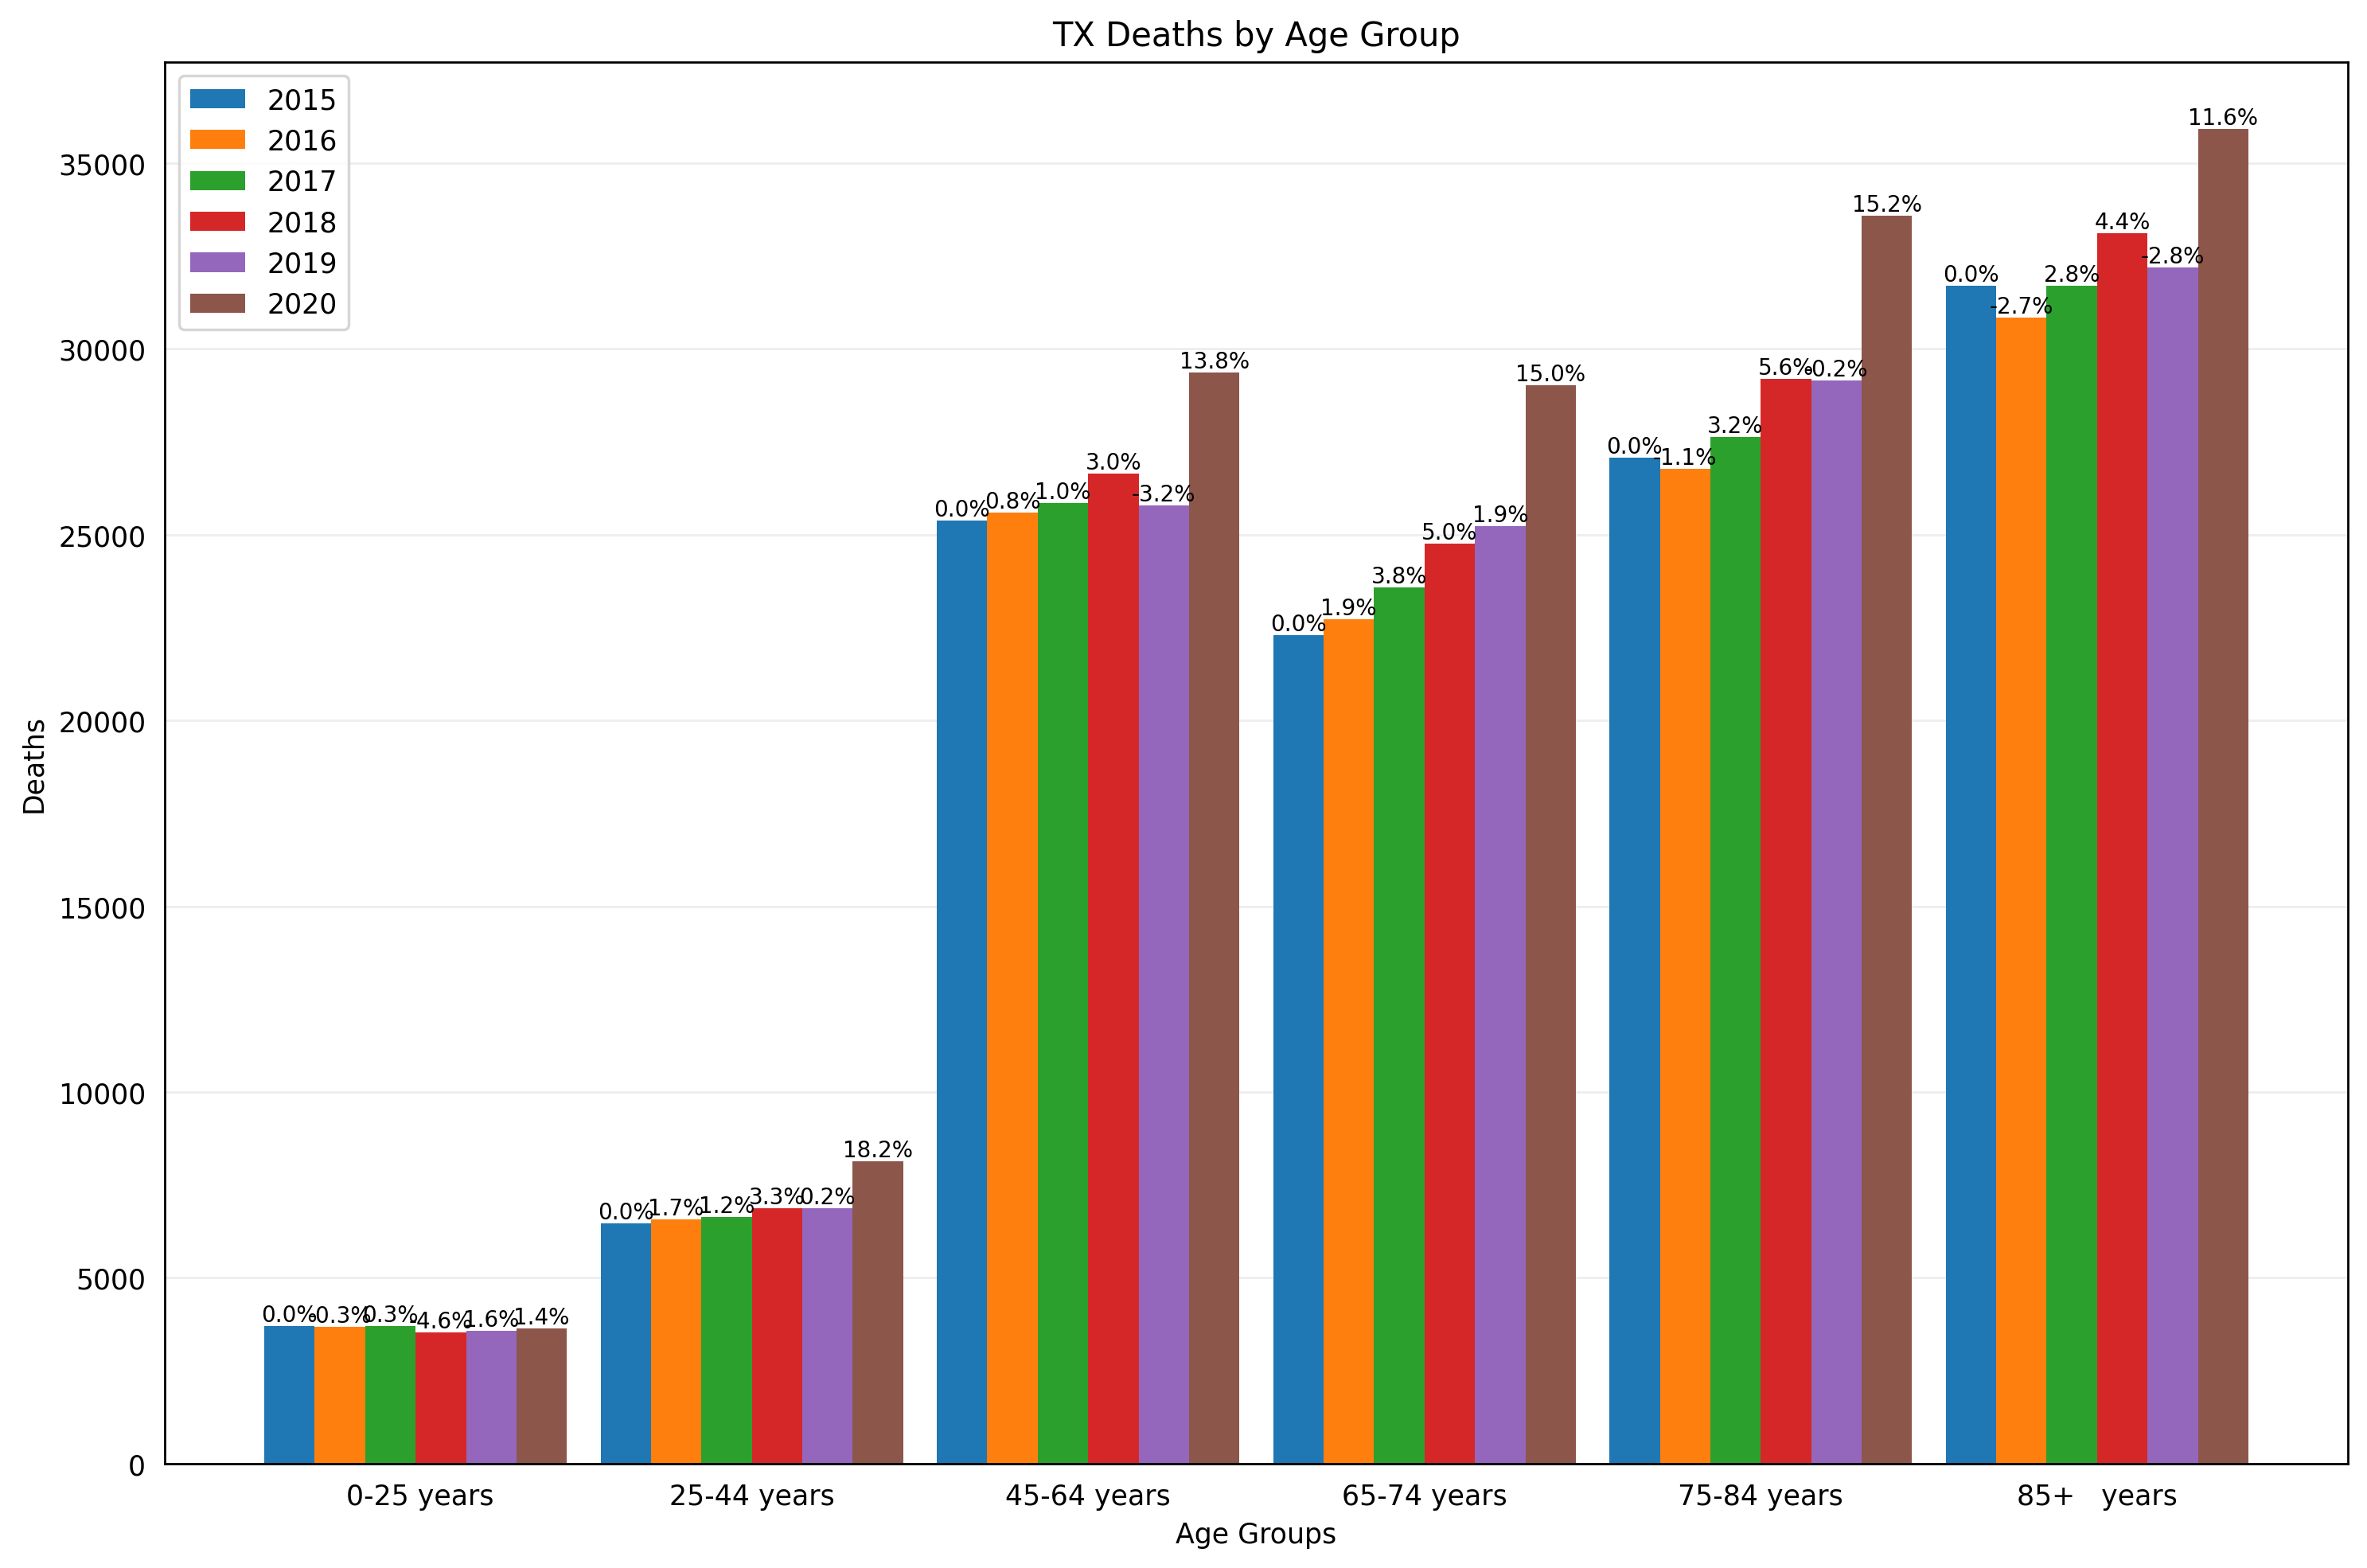 The largest increase has been in the 25-44 year old age range. It’s probably Texas hasn’t had as much of a proliferation of COVID19 yet and most of the spread has been related to young gathers. Leading to our next section…
COVID19 Spread due to Gatherings
It’s important to acknowledge, that as people gather Coronavirus spreads more easily. Particularly, in Texas, Florida, Illinois and others started to see a rise in fatalities (and infections) following rises in heat (pushing gatherings in doors), protests, and generally opening bars.
Particularly, the rise of deaths in Texas coincide directly with the protests (Starting week 22 and rising to the present):
 This also makes sense as to why the group seeing the largest increase in “risk of dying in 2020” are those 25-44 years of age.
Florida has seen the same effect, in the exact same time range:
 It’s difficult to attribute these increased fatalities directly to events, as there are many factors co-mingling to create the situation. Personally, I suspect heat is the largest factor. People gathered outside to protest or celebrate (July 4th) and ended up congregating inside, without masks. This lead to an increase in spread and fatalities, as moving indoors confines people together, in air conditioning, with minimal mask protection or UV to kill the virus.
Simulating COVID19 Spread
Finally, in prior discussions I’ve made predictions. Largely, these predictions came from running simulations (both on my own and available to me). As it stands, I continue to stand by my prior prediction:
- 3 million COVID-19 deaths in the United States is likely (April 1, 2021)
- 25% [true] unemployment in the United States is likely
- 15% reduction in GDP is within reason
Rerunning prior simulation(s) with some minor adjustments to account for new information (such as mask use) and assuming moderately widespread school reopening(s) (and assuming children spread COVID19). The simulation framework (click to alter simulation parameters) I’ve been using from Research group of Richard Neher at the Biozentrum, University of Basel shows the following:

That’s an estimated 180k to 1.85m dead by October 14th. Personally, for the officially count, I’d err on the side of the lower values, perhaps 250k. However, I suspect deaths will be under counted due to lack of testing, I suspect the real figures will be closer to 500k-800k after analysis, this would more closely matching the findings above (which indicate we are already over 200k).
Closing Thoughts
There are still plenty of unknowns related to COVID19. Only time will tell, but we can see most people “checking out” so to speak. It’s important to keep up to date regarding COVID19 (and politics) in general. A disaster is looming, largely this disaster could be resolved through citizens supporting known methods, wearing masks, distancing, etc.. To gain said trust, it’s important to have honest dialog from health experts (aka masks anyone?). Share true numbers where possible, suggest a more conservative safety program
Best of luck, stay safe!
Underreport / underreported is one word, no? Do you have any grasp on how the accuracy and reliability of US figures have been compromised by political interference?
Personally, I think there is minimal political interference here. I do think they may be testing less, but I suspect that’s due to lack of reagents and / or they are closing facilities. However, I don’t have any evidence to support anything.