
Firearms (guns) are one of the hot button issues in the United States and globally. I’m sure it is understandable why — pull the trigger and something dies. Killing is the primary purpose of a firearm. Naturally, this leads many to be fearful of firearms, but should people be fearful?
When I started writing this, I wanted to answer:
Are firearms inherently unsafe?
Should firearms be banned, as many believe?
It’s quite ambitious. One may believe you can just find an answer on a website / paper somewhere or is obvious. Unfortunately, the reality is far more complicated and has turned this into my longest article to date.
It’s been said,
Guns don’t kill people, people kill people. – unknown
Many agree and many others strongly disagree. That divisiveness has made firearms a political issue, leading to a plethora of bias studies, inaccurate analysis, and more. Thus, to answer these questions I had to go through the data myself; I pulled data from the CDC, FBI, RAND, Census and others and completed my own analysis.
For those interested, a PDF version of this document you can download here: Firearms by the Numbers.
Introduction
Due to the nature of this analysis, it is important to highlight some items upfront.
1. The United States is often the focus throughout the analysis. This is because the United States has an abundance of firearms, a relatively uniform society and the most available & accurate records.
2. This analysis focuses on general trends. Specific situations vary wildly, even in the same region: country, state, county, city, and neighborhood situations vary. As such, I caution making detailed / specific inference, beyond what the data explicitly shows (in the general case).
3. Some important data is lacking, such as socioeconomic status associated with crimes. This makes it very difficult to isolate confounding factors and leads to confusion / lack of definitive answer(s).
The goal of this analysis was to analyze available (and unbiased) data as in-depth as enabled, with no particular outcome in mind. If new data comes in that materially changes what can be inferred, I’ll attempt to update the analysis. With that in mind, I want to highlight that I dive into demographic information and I found some surprises. Politics seems to stifle this topic and in fact the truth. Instead I went to the data, I hope you can find it as interesting as I do.
The truth is not for all men, but only for those who seek it.
– Ayn Rand
If anything in this analysis was missed, please feel free to reach out or leave comments.
Firearms Globally
Globally, firearms are highly controlled, particularly in the Europe and Asia. In contrast, the United States has more firearms held by it’s citizens than the rest of the world combined.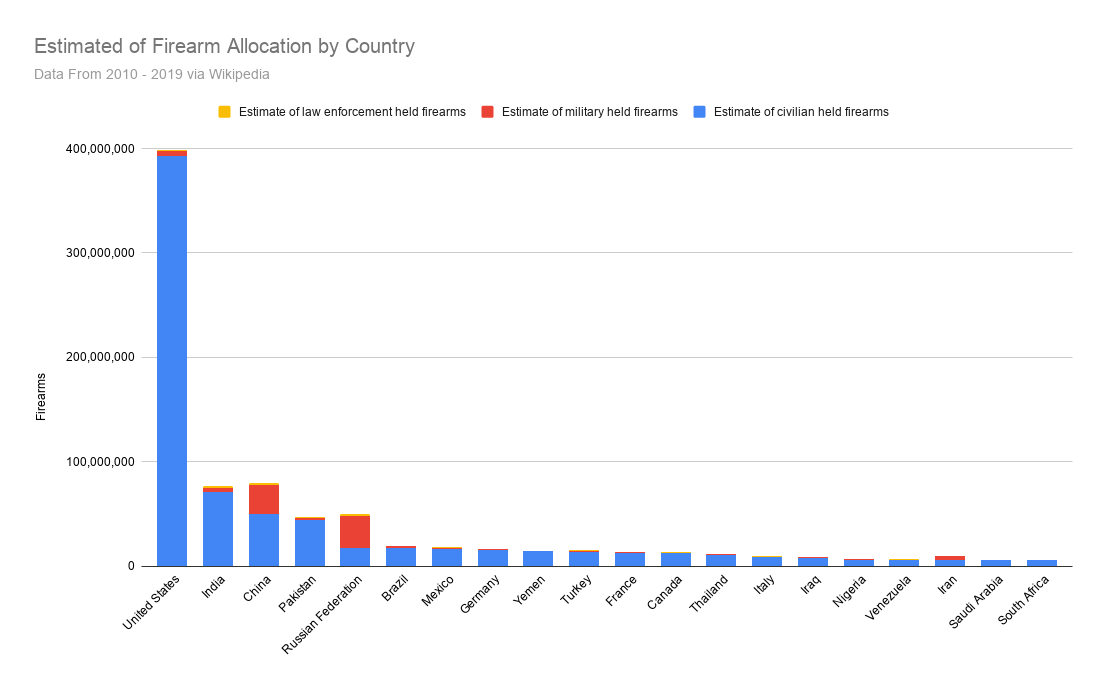 The real question — do the number of firearms really matter? From the graph above, it’s clear China, Russia and Iran have a high number of military firearms when compared civilian held firearms (and I suspect most civilian held firearms are former military, in countries such as China, Russia ,Iran, India, etc). In contrast, the “free world” has an order of magnitude more civilian firearms, when compared to military firearms.
Clearly, what matters to “second world” is having a large military arsenal, when compared to civilian held firearms.
It can be argued an unarmed society allows the military to impose their will, allowing countries to maintain the status quo and avoiding violent revolutions overthrowing the government.
Homicides & Firearms Globally
In the “free world,” the main concern surrounding firearms are homicides & suicides, with homicides being the most concerning. Below is a comparison of homicides by firearm deaths per 100,000 people across the globe.
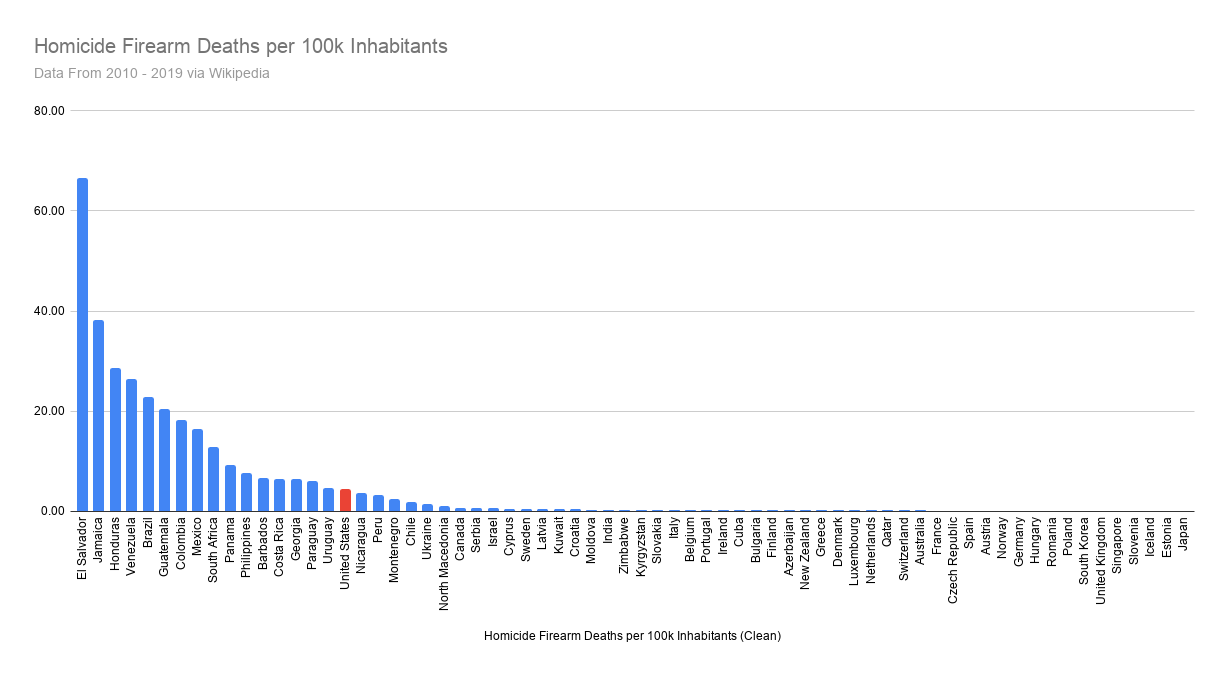 When we compare the world, a few things become clear:
- The America’s, Caribbean and Africa have a much higher firearm homicide rate
- The United States has the highest firearm homicide rate of a “first world” country
- Europe has the lowest firearm homicide rate globally
What’s not clear, is whether or not firearms are really leading the increased firearm homicide rate.
Are homicides just naturally higher in these regions?
Firearm Death Rate per Firearm
Below is an argument from the Amnesty International’s website:
governments [with] poor regulation of the possession and use of guns lead to violence and that they must tackle this now through strict controls on guns and effective interventions in communities suffering high levels of gun violence.
The key statement is:
Guns lead to violence
The statement above implies a couple of things:
- Gun volume and violence are correlated
- As the number of guns increase, violence increases
There are a few ways to invalidate / validate this statement. The clearest method is to simply compare firearm deaths per firearm. If firearms lead to more violence, we should see the ratio of firearm deaths to firearms (firearm deaths / firearms) staying constant (or growing at a constant rate). This ratio should stay or grow at a constant rate because as the firearm count increases, the firearm homicides should increase (keeping the ratio constant). We could also assume a direct correlation if “guns lead to violence” as it would probably occur at some constant rate.
Below you can see the comparison between firearm deaths and firearms:
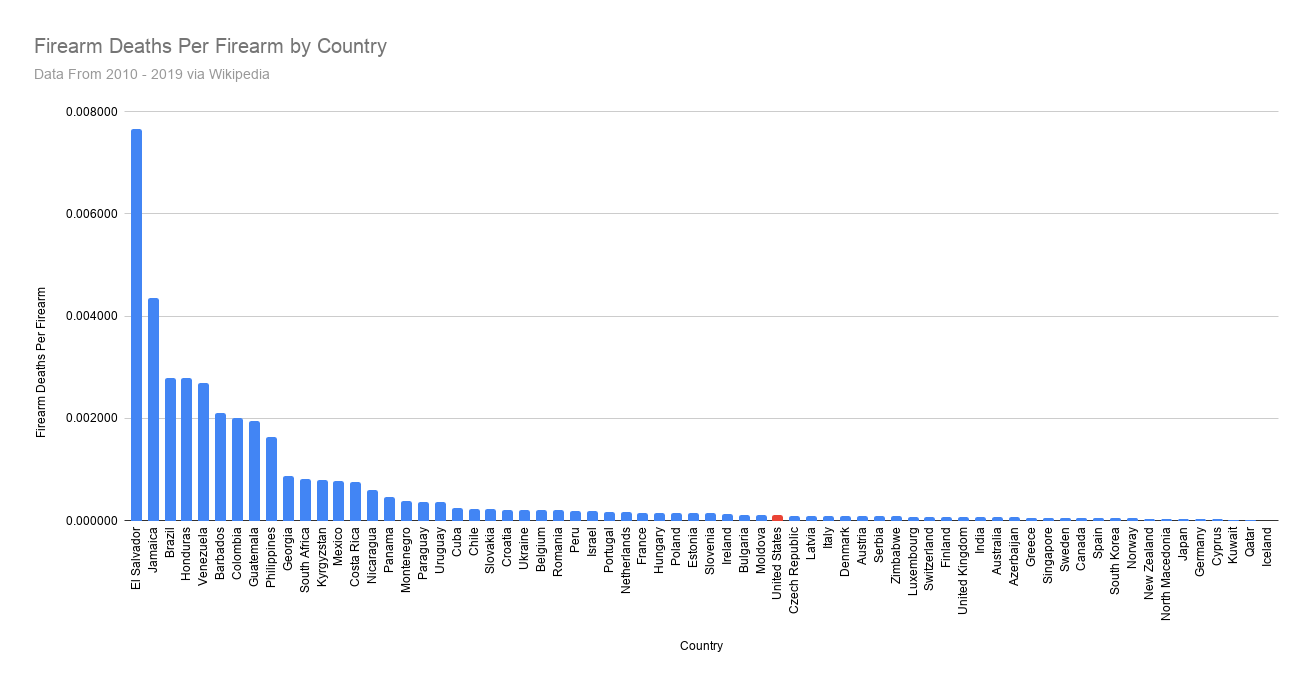 As seen in the chart, the Caribbean, South America, Africa have a high number of firearm deaths per firearm, Columbia having one death per five hundred firearms. In contrast, “First World” (Europe and the United States) has a much lower number of fatalities per firearm, the United States having only one death per ten thousand firearms.
Firearms vs Homicide Rate
For further evidence firearms aren’t correlated with violence, it’s possible to directly compare the number of firearms vs homicides: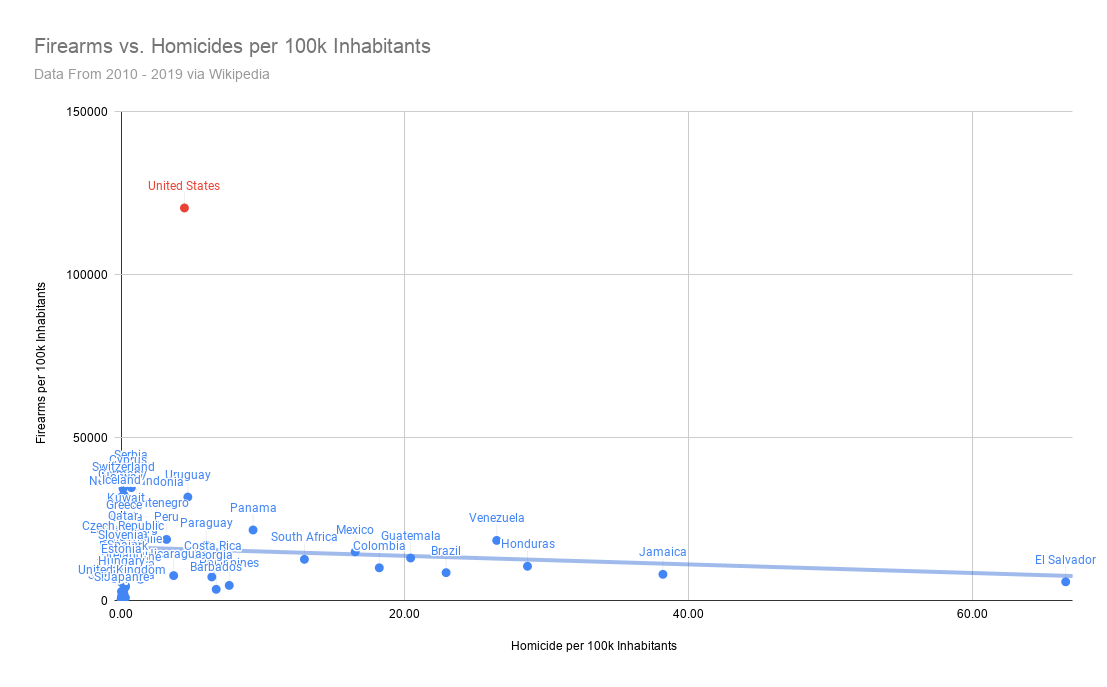 Across the bottom of the chart you can see all the countries with high homicide rates. The United States stands out clearly, if firearms were correlated with homicides we’d expect the U.S. to have many more homicides than it currently does. It does not appear more firearms are correlated with more homicides, in fact the trend line shows the opposite to be true (more firearms are correlated to less homicides).
For a final validation, we can compare firearms against homicides and firearm homicides against total homicides. Both should have a similar growth rate, if there was a correlation.
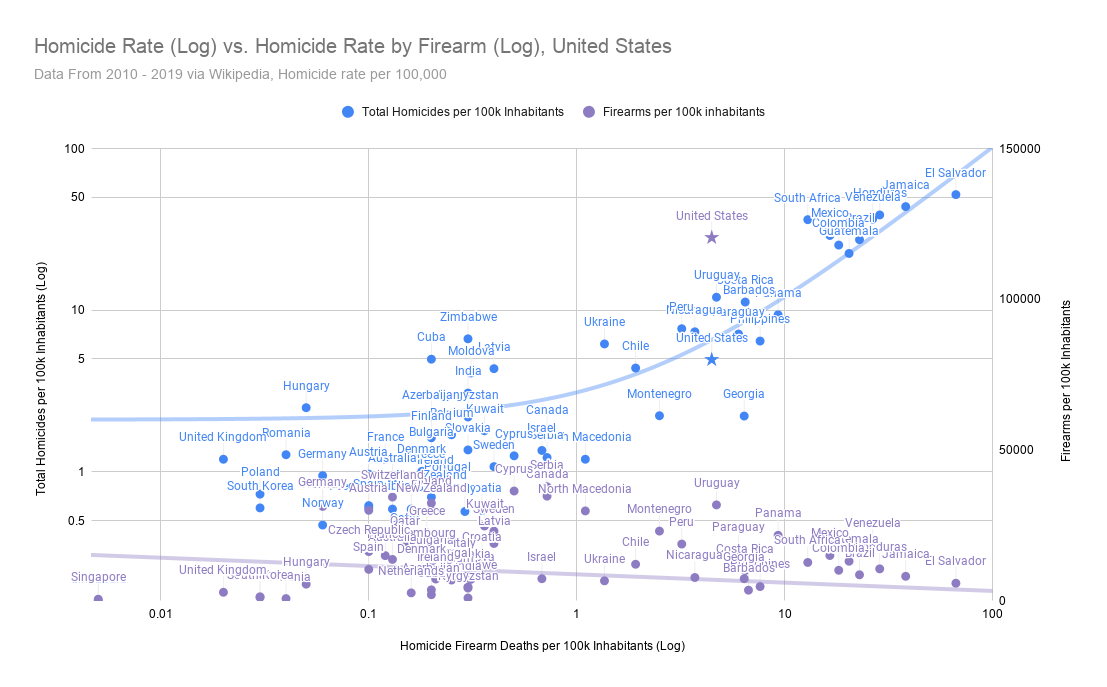
It’s important to note the graph is a logarithmic comparison for homicides and homicides by firearm (firearms per 100k Inhabitants are not logarithmic). The trend line comparison of Total Homicides and Homicides by Firearm is linear, because the comparison is logarithmic, it appears exponential on the chart.
It is clear as homicides increase, homicides by firearm increase (blue data points). In contrast, when there are more firearms, homicides by firearm remain flat (purple data points), implying more firearms do not cause increase the number of homicides involving a firearm.
Further, you can see the blue star representing the United States homicide rate to homicide firearm deaths is right where it is expected. However, the purple star, representing the United States homicide rate to firearms per 100k inhabitants, is way outside the norm.
To summarize,
Globally, as the firearm homicide rate increases, the total homicide rate increases; as the prevalence of firearms increase, the homicide rate does not increase.
Firearms in the United States
The United States is clearly the largest holder of firearms in the world, most states have more firearms than entire countries. Fun fact:
Texans and the Chinese military have the same number of firearms.
Clearly, there’s a culture of gun ownership in the United States. When the United States was formed it had just fought a war of independence and regularly combated Native Americans, settling North America by force. Even today, the United States National Guard is one of the largest militias in the world.
A well regulated Militia, being necessary to the security of a free State, the right of the people to keep and bear Arms, shall not be infringed.
– Constitution of the United States
Without diving into politics, the constitution & culture has enabled the United States to be relatively unique. Firearms are regulated, but just barely. Generally, citizens can do everything from carrying a firearms in public to purchasing assault rifles, flamethrowers, miniguns, rocket launcher(s), etc. Often the only requirement is obtaining permit to own weapons, after that you can regularly purchase as many firearms as you’d like.
As seen in the previous section, the United States does have a higher (on average) number of firearm deaths. However, this doesn’t necessarily tell the whole story. In the prior section, we focused on the homicide rate. In the following sections, the focus will expand as uniform data collection, similar social norms and a widespread framework for law makes comparisons much easier.
Some topics we will explore here are:
- Suicide vs homicide vs accidental rates
- The type of weapons used in homicides
- How demographics impact firearm fatalities
- How firearm fatalities compare to other fatalities
Suicides & Homicides in the United States
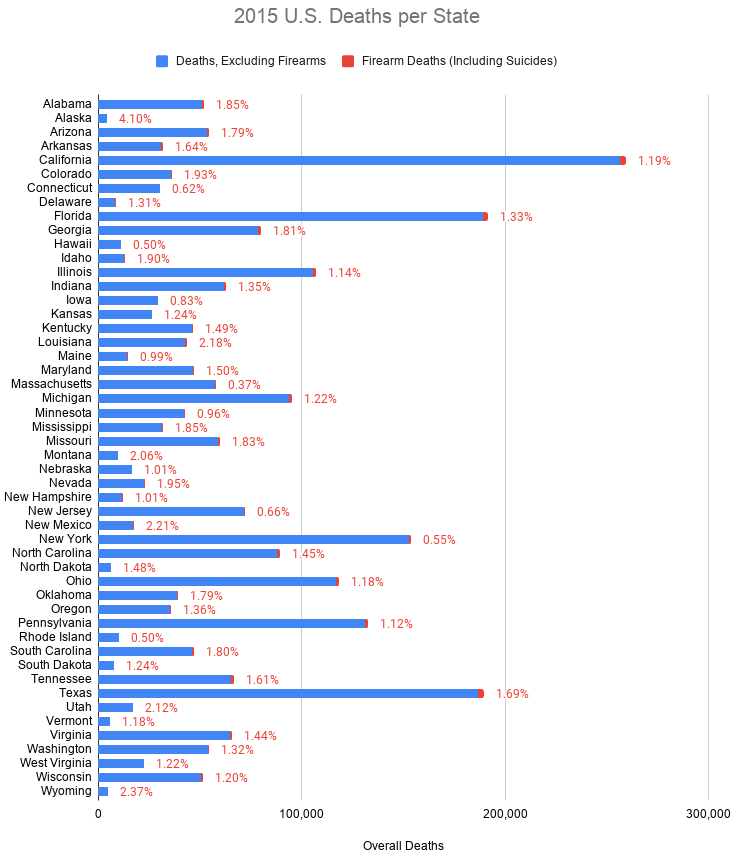
First, it is also important to highlight just how small the number of firearm related homicides really are, when compared to all deaths. On average, the total (suicide, homicide & accidental) number of firearm related fatalities account for about 1.33% of all deaths in the United States (firearm related homicides account for ~0.44% of all deaths) and it varies wildly between states.
Perhaps the most important item to discuss is the “firearm fatality rate“, often conflated with the “firearm homicide rate” by political pundits. While all fatalities are unfortunate, most American’s would argue there is a different between suicides and homicides. Some states, such as Washington, support medically assisted suicides (for the terminally ill).
Below is a comparison between accidents, suicides and homicides by firearms in the United States.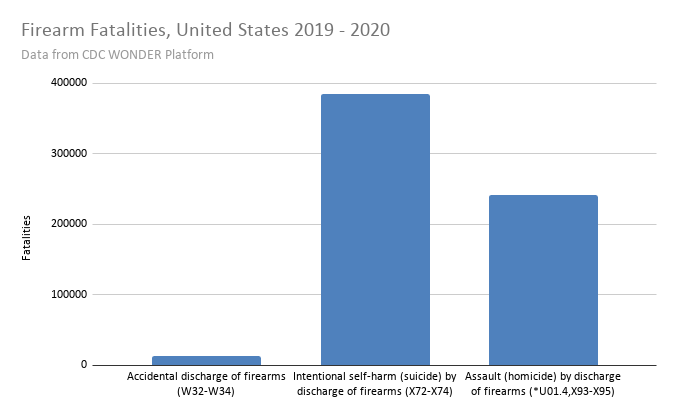 From the chart above, it is clear suicides are far and away the leading cause of firearm fatalities (~60% more suicides than homicides). Further, firearm related accidents resulting in a fatality is very uncommon (when compared to suicides or homicides).
One thing that becomes more interesting. Is that The distribution of accidents, suicides and homicides become more interesting as we split out demographics.
Firearm Related Homicides by the Demographics
Although suicides are the leading cause of firearm related deaths, a more detailed story is told when breaking out the demographics. By gender 86% of firearm related deaths are from males, with 14% of firearm related deaths from females, see the chart below.
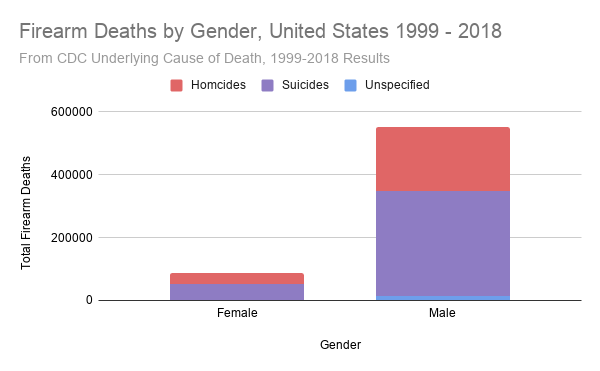 As shown the chart above, males lead in both homicides and suicides. Next, let’s break it out by race.
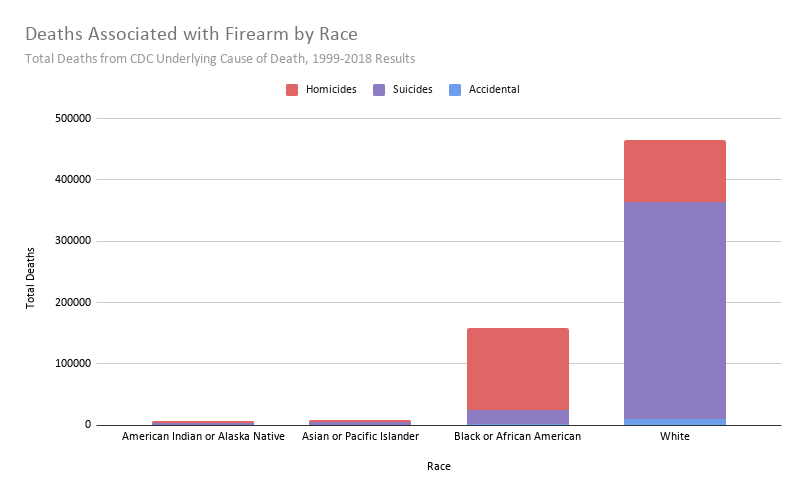 The total numbers White American’s have far moreoverall firearm related fatalities (around 70%), while African Americans account for 55% of homicides (African Americans are 13.4% of the population). When population is taken into account (i.e. normalizing by population), it appears firearm related fatalities are about twice as likely in African American populations than White or American Indian populations.
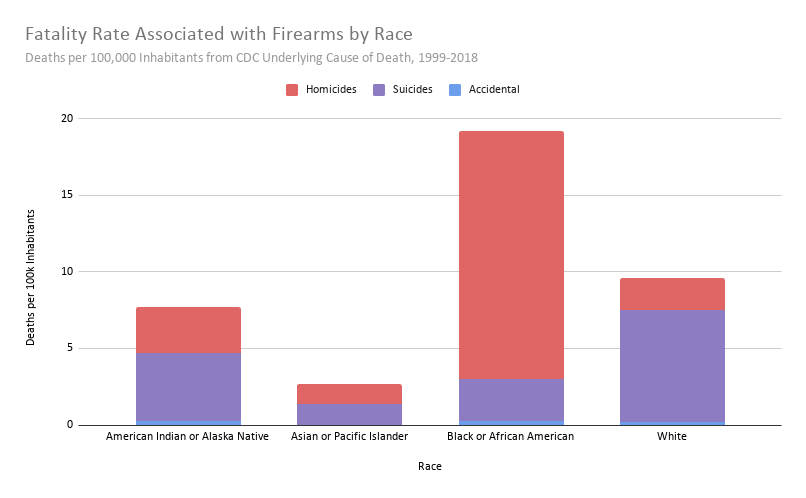 More striking, is that the homicide rate among the African American population is about 9x that of the white homicide rate. To explore this further, let’s look at it by year, the homicide rate is also remarkably consistent.
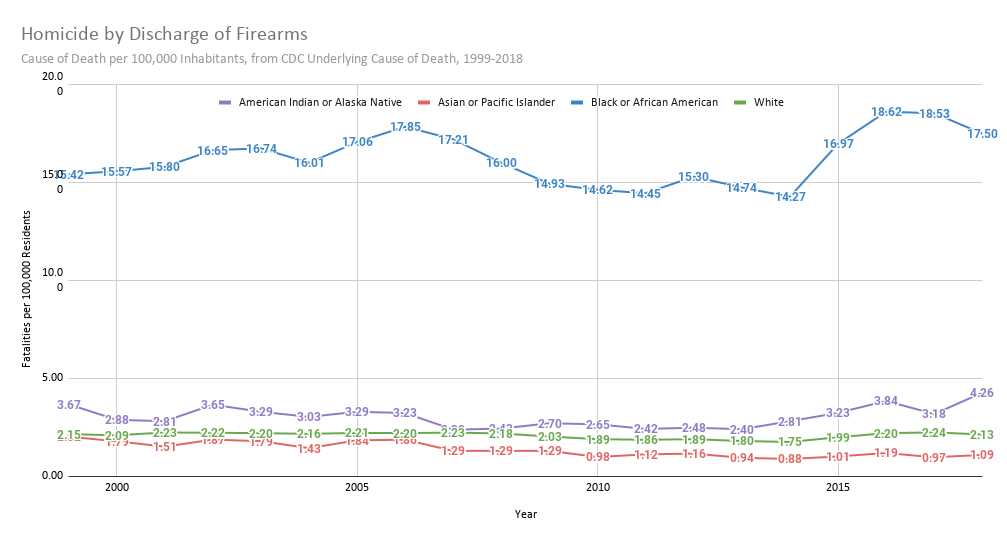 It’s also important to note, these are victims of homicides. Meaning African Americans are far more likely to be murdered via a firearm, but we don’t know the offending race.
Cross Racial Homicide Rates, United States
To compare the perpetrators and victims homicide, it’s possible to access Table 6 provided by the FBI’s Crime in the United States dataset, the chart below is from 2018.
|
Race of victim
|
Total
|
Race of offender | |||
| White | Black or African American |
Other1 | Unknown | ||
| White | 3,315 | 2,677 | 514 | 61 | 63 |
| Black or African American | 2,925 | 234 | 2,600 | 17 | 74 |
| Other race1 | 220 | 54 | 39 | 122 | 5 |
| Unknown race | 110 | 46 | 24 | 7 | 33 |
The provided data indicates that murders rarely cross racial lines. Overall, the percentages are as follows:
- 88.8% of African American murders occur by African Americans
- 7.6% of African American murders occur by Whites
- 80.8% of White murders occur by Whites
- 15.4% of White murders occur by African Americans
Arguably, this means that we can extrapolate the offender count (by race) from the victim / incident count. Meaning, the African American homicide rate from prior sections, is likely African American on African American violence (similar for White, Asian, and Native Americans).
Firearm Related Suicides by the Demographics
To shift gears a bit, one of the more interesting aspects of firearm fatalities are the suicide rate, particularly the large number of suicides by White Americans.
Perhaps more unsettling, is that suicides are increasing by population since 2008, see chart below.
 In terms of the increase in firearm related suicides, since 2008 we’ve seen a 25 – 30% increase across all races. Currently, the White population commits suicide >4x the rate of homicides by the same population, while Asian or Pacific Islanders only have a suicide rate of 1.5x the rate of homicides by the same population.
Suicides & Homicides by Socioeconomic Status
To further explore homicides & suicides we have to explore socioeconomic status, as it’s often a confounding factor. Unfortunately, I was unable to find a firearm fatality rate associated with socioeconomic status. Thus, we have to explore socioeconomic impact in an indirect manner.
Below, you can see a comparison between the homicide & suicide rates for a states average income, income being a proxy for status.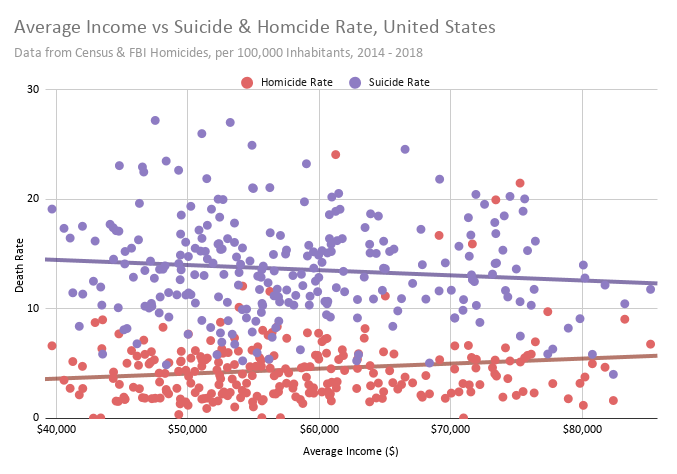 To be honest, not a lot of information to be gleaned from the chart. Another approach was necessary.
Instead, I compared the poverty rate, suicide rate, homicide rate, homicide rate with a firearm, and average income; see the resulting graph below:
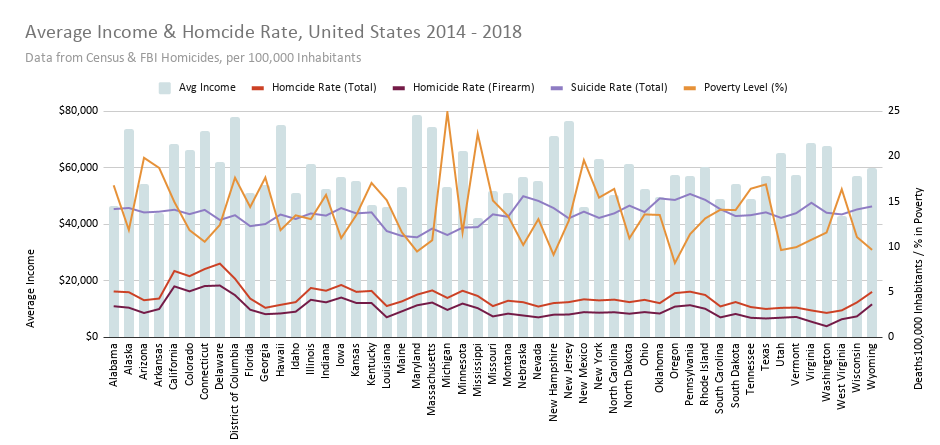
Poverty level appears independent from homicide rate and suicide rate. Similarly, suicide rate appeared independent from suicide rate. The only two trends that track together are the firearm related deaths and homicides (not firearms).
Thus, it is really not clear how socioeconomic status impacts the homicide rate. Without additional data, it is unclear any additional insights are possible. It is possible socioeconomic status does not impact the homicide rate.
Firearm Related Suicides & Homicides by Age Group
In terms of the age, firearm fatalities are fairly consistent for those 15 years and older. Depending on the age group, 10-15 people per 100,000 inhabitants die from a firearm related incident.
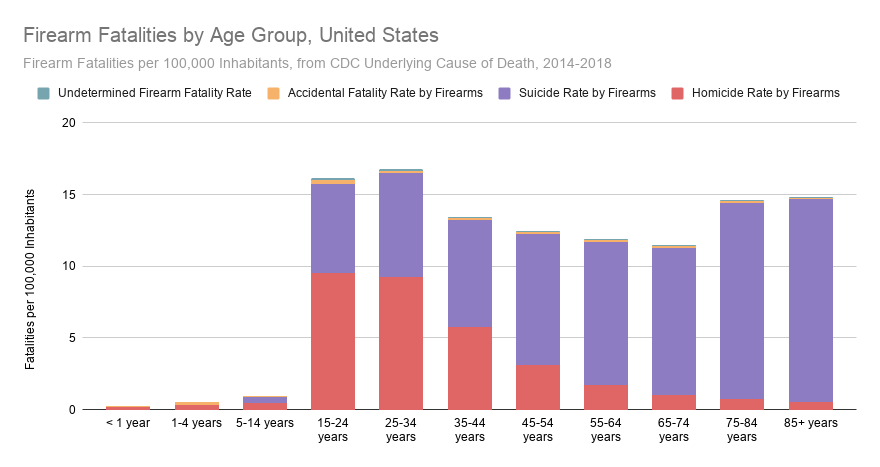 What’s worth highlighting is that the homicide rate peaks between 15 – 34 years old, with 9 homicides involving a firearm per 100,000 inhabitants. After 34 years old, the homicide rate from a firearm drops perspicaciously and by 55 the homicide rate by a firearm is below 3 per 100,000 inhabitants. In contrast, the suicide by firearm increases from 34 to 75.
The largest group of those committing suicides by firearms are 75+ year olds, with a suicide rate by firearm peaking around 14 per 100,000 inhabitants. Previously, it was noted there is an increase in suicides by firearm (a 25% increase over the last decade). In part, the increase in suicide rate may also be due to an aging United States (the average age moving from 35.3 years old in 2000 to 38.4 years old in 2019[1], a 9% increase).
In contrast, age group(s) under 14 years old (and I suspect until 18 years old), firearms appear well controlled. The suicide & homicide rate by a firearm is very low. For the sake of comparison(s), the overall homicide rate for that group is much higher (than the firearm homicide rate), see the total figures below.
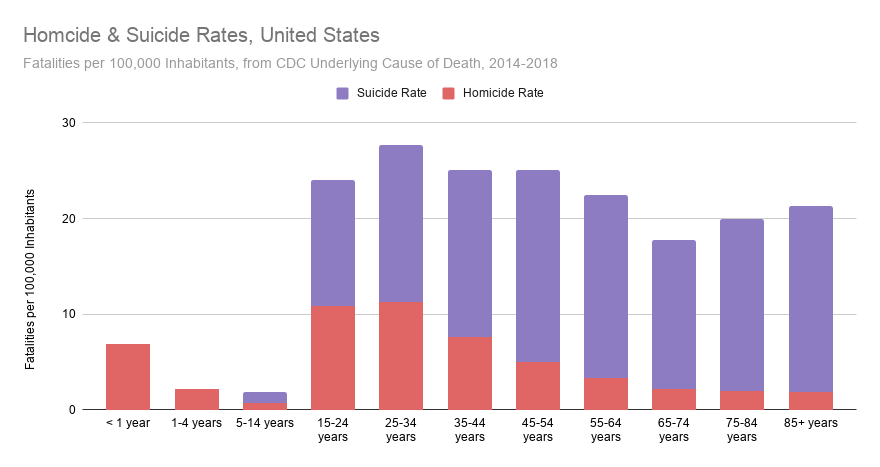 Notice, the overall homicide rate increases minimally (10-25%) when the non-firearm related homicides are included (after the age of 15 years old). In contrast, the overall suicide rate doubles when the non-firearm related suicides are included. Implying that firearms are weapon of choice for homicides, while other means are often used when committing suicide.
Homicides in the United States
Next, similar to the global firearm analysis, let’s revisit analyzing if firearms increase violence.
guns lead to violence
– Amnesty International
Globally, we showed that firearm related homicides follow the total homicide rate and firearm prevalence is independent of the homicide rate. For insight(s) about the United States, let’s compare the overall homicide rate (not just firearm related homicides) (~4.5/100,000 people in the United States per year, data from FBI) to the firearm ownership rate (~45,000/100,000 people in the United States, data from RAND Corporation).
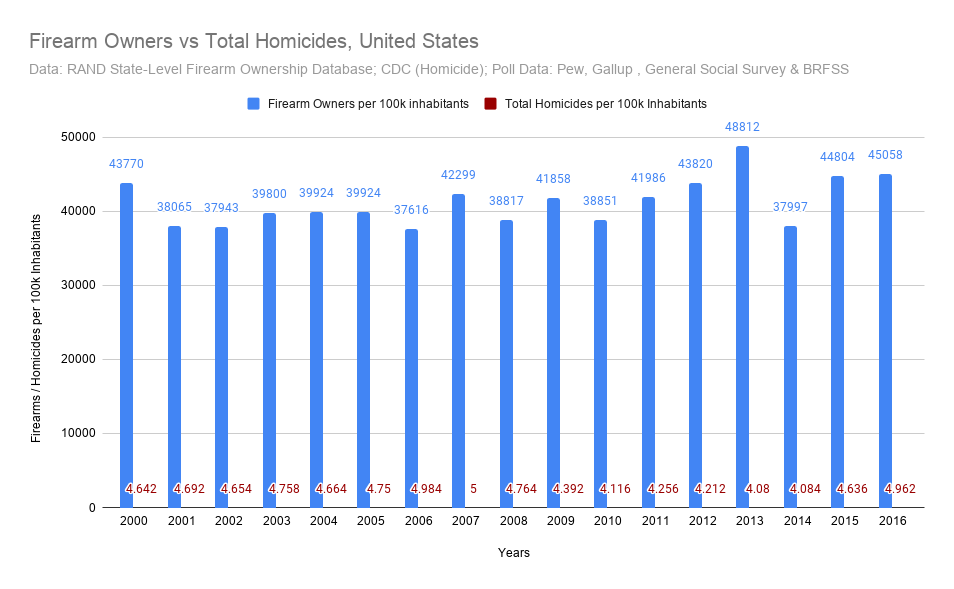
The number of firearms per 100,000 individuals is about 10,000x larger than the homicide rate. Arguably, this isn’t a fair comparison, as a homicide can only occur once per gun owner.
However, just as an exercise, let’s assume the following:
- All homicides are firearm related (reality check: ~70% involve a firearm)
- Legal firearm owners are committing 100% homicides
- Firearm owners own a firearm for an average of 50 years
- The U.S. has an average of 4.5 homicides per 100,000 inhabitants (reality check: depends on demographics)
Even with those outlandish assumptions, some napkin math indicates there’s a 0.5% risk that at some point a gun owner will commit a homicide.
4.5 homicide rate / 45,000 firearm owner rate
= 1/10,000 homicides per firearm owner (in a given year)50 years of firearm ownership * 1/10,000 firearm owners per homicide (in a given year)
= 0.5% risk of a firearm related homicide in a 50 year time frame
The numbers aren’t perfect, but the gist is there. The risk of a firearm being used in a homicide is very low and as shown in prior sections: weighted to a small selection of subgroup(s).
The “White” subgroup would have closer to 0.2% (50 years * 2/49,000 homicides per firearm owner) and the “Black” subgroup closer to 2.81%. (50 years * 18/32,000 homicides per firearm owner)[2].
Homicides per Firearm Owner, United States
Again, similar to the global firearm analysis, let’s compare the homicide rate across the states.
What becomes quickly clear are states with the most stringent gun laws (California, New York, Washington D.C., New Jersey etc.) actually have the highest number of homicides per firearm owner (at 0.034% of firearm owners commit a homicide in a given year).
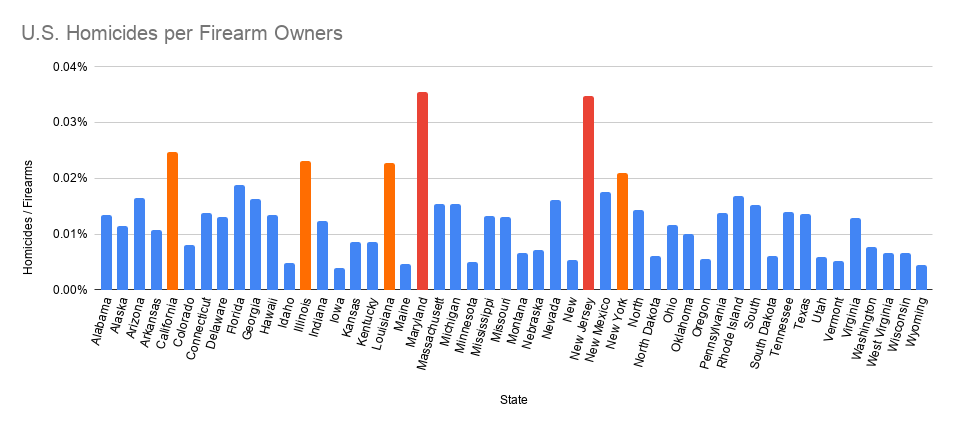 This does make sense, due to the strict firearm regulation(s) there are less firearms in circulation and only the “bad actors” will have weapons.
There does appear to be some credibility to the argument:
If you outlaw guns, only the bad guys would have the guns
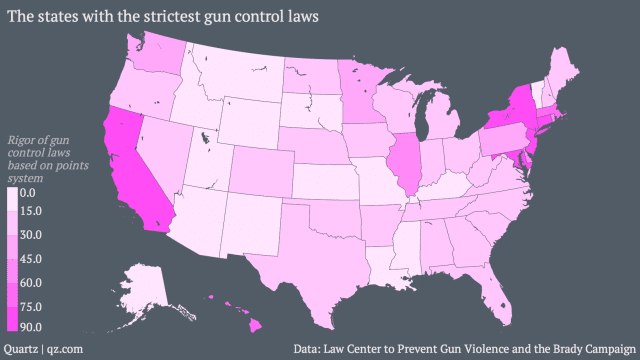
If mapped, it’s obvious specific regions have a higher homicide-per-firearm rate:
 It is also clear that the states with a high homicide-per-firearm rate mirrors states that have lower firearm ownership.
 To search for correlations, let’s compare firearm owners vs the number of firearm related homicides in a given state, see below.
 The trend line is essentially flat, implying the number of firearm owners has no impact on the number of firearm deaths (similar to the global level). What does appear to change in lock-step is the overall homicide rate. As the overall homicide rate increases, so does the firearm related homicide rate.
 This is reasonable, firearms are simply one means of murder (as is stabbing, strangulation, etc.), across states the method(s) of homicide(s) stay relatively consistent; the primary weapons of choices being a firearm.
The above two charts essentially proving the theory that,
Firearm related homicides follow the total homicide rate, independent from the firearm ownership rate.
Murder Weapons in the United States
Although total homicides are independent of the firearm ownership rate, it is clear why there is a belief that eliminating firearms could reduce the overall homicide rate. If homicides involving firearms are highly correlated with homicides, removing firearms should reduce the other – right?
Actually, as indicated in the prior section(s), the “bad guys” would still have firearms — even with strict laws. Further, knives, fists, bats, etc. still account for a large number of homicides and there’s no reason to believe removing firearms would not result in an increase in alternative murder weapons.
At this point, the real question is what are the circumstances surrounding homicides. Would removing all firearms actually change the circumstances?
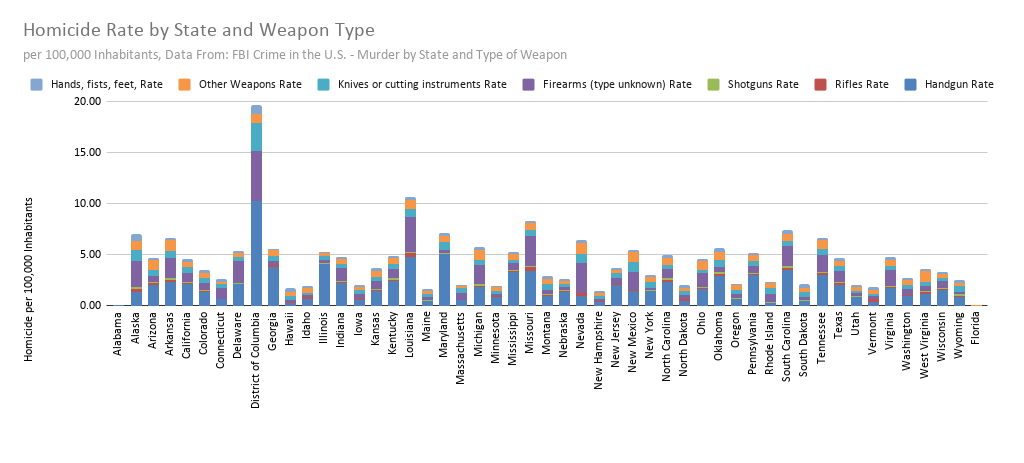
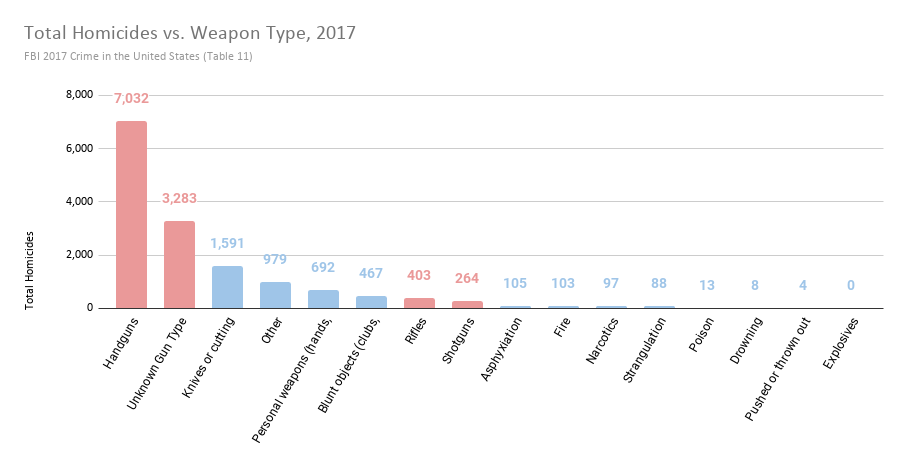
Hands, fists, and feet are about 2x more common as murder weapons than rifles (including assault rifles) or shotguns.
About half of all homicides involve a handgun, followed by murders with an unknown gun type (i.e. poor record keeping or a low murder solve rate), then knives, fists/feet/etc., objects, and eventually rifles and shotguns.
 These methods of murder are remarkably consistent across years as well, below is a year-over-year comparison of firearms & knives as a choice of a murder weapon.
 To understand why handguns and knives are so prevalent as murder weapons, we can also look at the circumstances surrounding the murder (i.e. robbery, fight, etc.).
Circumstances Surrounding Homicides in the United States
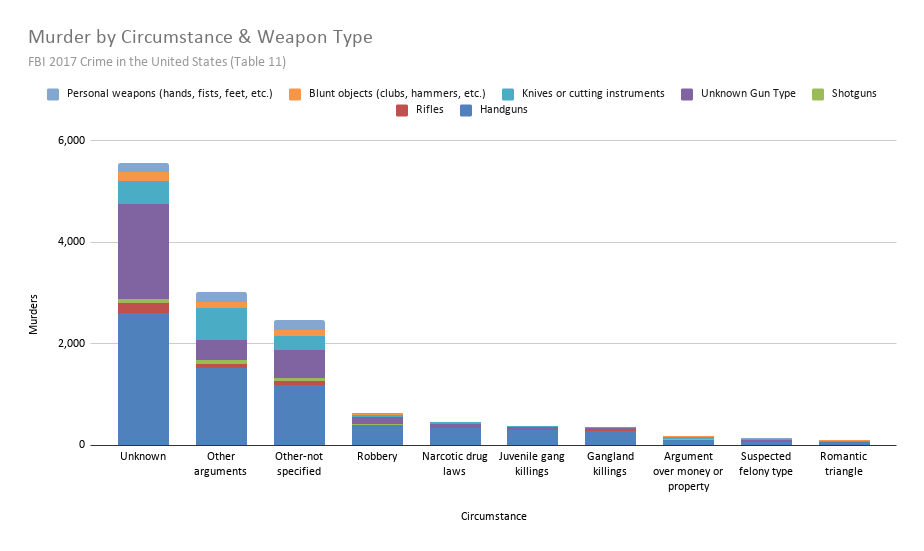
The first thing that stands out is how little we know, we don’t know the circumstances surrounding at least 60-70% of homicides. For the circumstances we do know, gangs appear to be the largest single culprit. At least three categories above being directly related to gangs: Narcotic drug laws, Juvenile Gang Killings, Gang Killings. Further, homicides by gangs & during robberies appear to overwhelmingly favor handguns.
What does this imply?
Gangs, as the leading [known] circumstance(s) surrounding a homicide drive a large number of the firearm (particularly handgun) fatalities. The facts appear that organized crime (gangs) overwhelmingly impacts the distribution of what is used as a murder weapons. This implies the average citizen probably doesn’t contribute meaningfully to the number of handgun related fatalities (unless it’s in the hands of a gang member).
Similarly, gangs are rarely (if ever) recorded using [assault] rifles or shotguns. Arguably, this is why handguns account for 10x the number of homicides than shotguns and rifles.
Gang Demographics & Homicides in the United States
From the data, it is clear those at the highest risk of committing homicide and being victims of homicide are:
- African American
- Males
- Between 15 and 35
- Participating in gang activity
Interestingly enough, the homicide distributions we found the FBI & CDC datasets match the National Gang Center. Generally, the homicide rate matches gender and age distributions in memberships of gangs. The one deviation appears to be race.
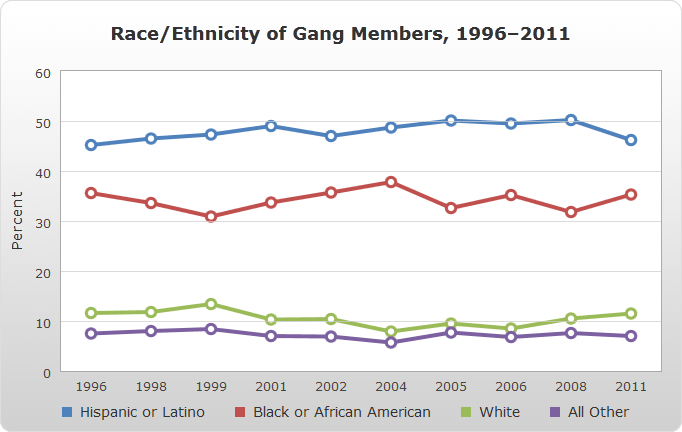
Notable in the chart above, Hispanic or Latinos are the largest group of gang members, followed closely by African Americans.
Where the Hispanic population was in the CDC & FBI data?
Hispanic & Latinos in the United States
The CDC & FBI merge Hispanics as a sub-category under another race, below is a table with data from 2018:
| Race | Hispanic Origin | Injury Intent | Deaths | Population | Death Rate Per 100,000 |
| Black or African American | Hispanic or Latino | Homicide | 130 | 3,328,020 | 3.9 |
| Black or African American | Not Hispanic or Latino | Homicide | 9,543 | 42,934,826 | 22.2 |
| White | Hispanic or Latino | Homicide | 2,863 | 53,495,958 | 5.4 |
| White | Not Hispanic or Latino | Homicide | 5,531 | 201,068,278 | 2.8 |
| Total | 2,839,205 | 327,167,434 | 867.8 |
According to the CDC 25% of the white population have a Hispanic or Latino family origin, compared to only 10% of African Americans. The number of “White” Hispanics or Latinos being 17.7x larger than the “Black” Hispanic or Latinos.
What does this mean? Simply,
Gang membership plays a smaller role in who commits a homicide, than race, age or gender.
If gang membership had an impact on the homicide rate, the “White” homicide rate be much higher (due to the large number of “White” Hispanic or Latino gang members). Instead, there is a low homicide rate among “White” people of Hispanic or Latino origin and a high homicide rate among “Black” people of Hispanic or Latino origin.
It is not in the data, but it is possible Hispanic or Latino gangs are fundamentally different than African American gangs, contributing to the discrepancy.
Comparing the United States by Race
The fact remains — homicide victims (and perpetrators) disproportionately have the following characteristics:
- African American
- Males
- Between 15 and 35
Participating in gang activity<– Already determined minimal impact
This particular group both perpetrates and are the victims the most homicides in the United States. If we were to split the United States into a “White” and “Black” subset and compare globally, it dramatically shifts the homicide related firearm deaths.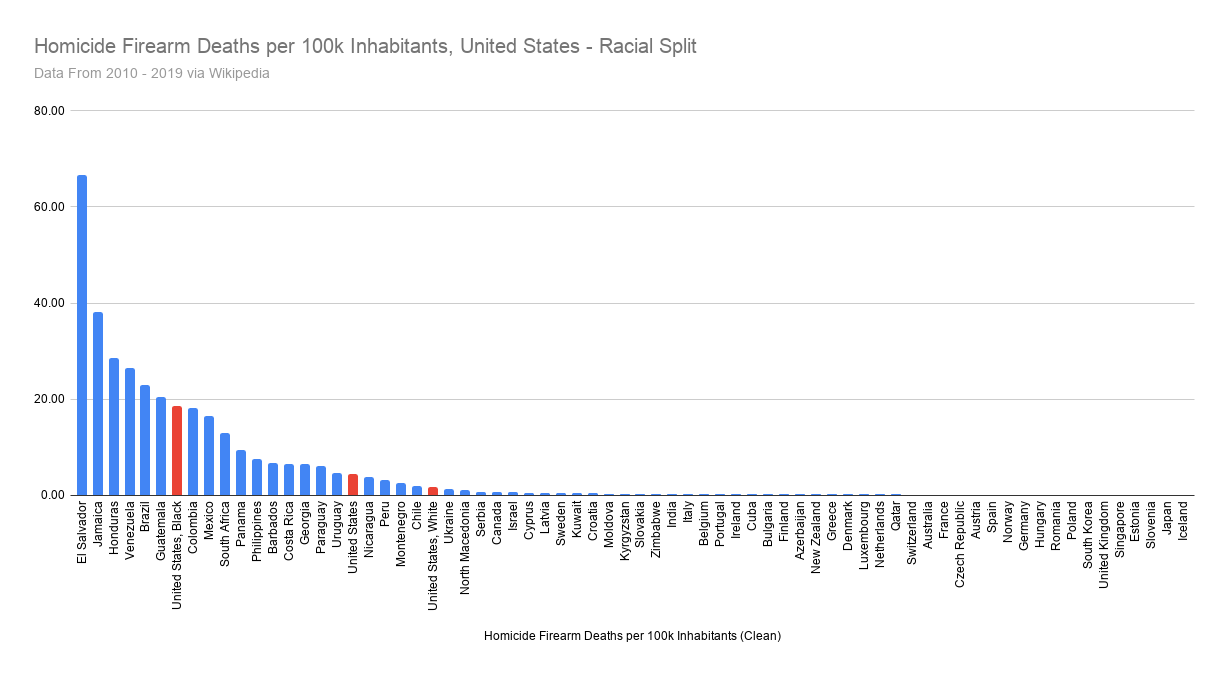 Race differences become even more stark when we compare the firearm related fatalities. According to Pew’s Research, African Americans hold less firearms (and to reiterate, account for the majority of homicides):
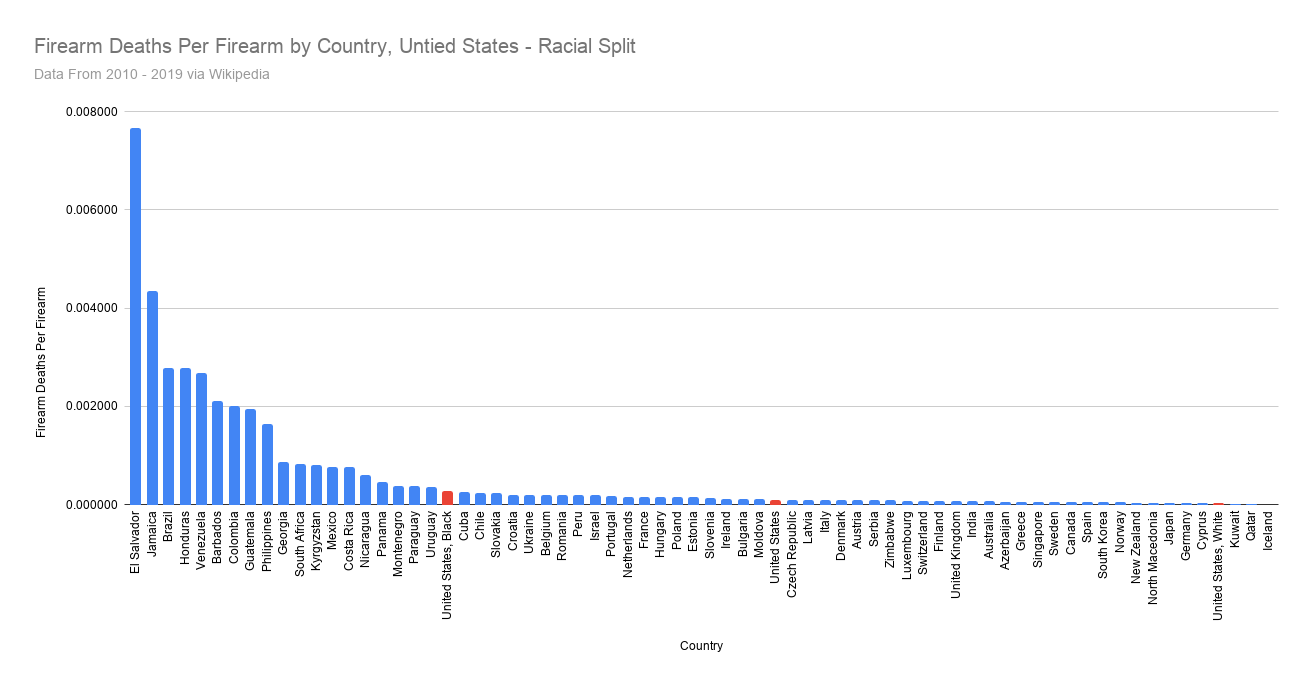 If separated by race, White Americans would actually have one of the lowest firearm related death rates globally. More over, I feel it’s worth mentioning, this analysis is somewhat unclear, as we don’t know the circumstantial differences.
Justified Homicides in the United States
Another important topic and relevant to current events are the justified homicides, aka self-defense. The numbers are pretty interesting, private citizens in the United States account for 43% of the justified homicides between 2014 and 2018, Law Enforcement accounting for the other 57% of the justified homicides.
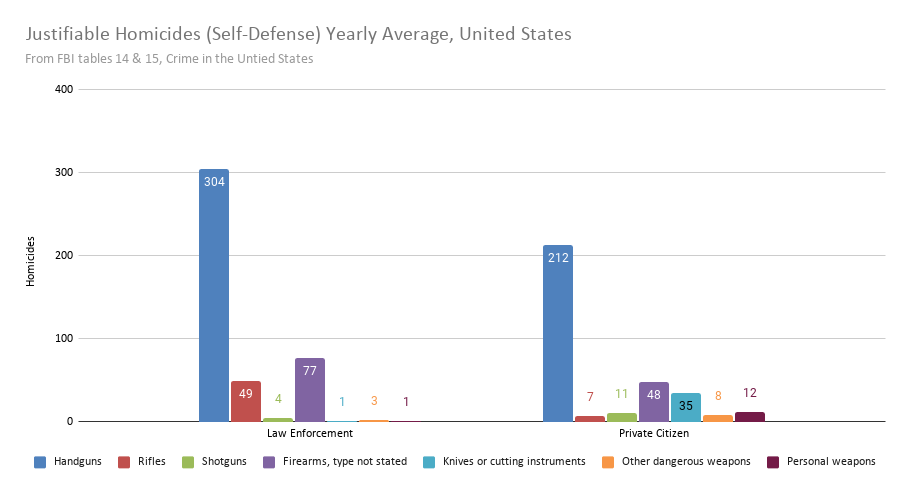 From the chart above, firearms are clearly the weapons most used in self-defense, with Law Enforcement almost exclusively using firearms. This makes sense, as in the United States Law Enforcement often carry non-lethal tasers with a back up firearm(s), when lethal force is necessary. For reference, let’s compare the number of homicides to total justified homicides (combined civilian and law enforcement):
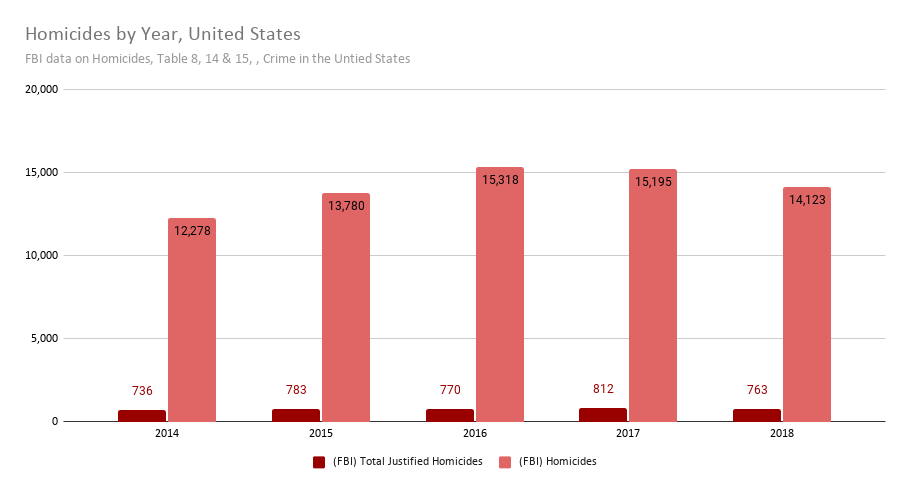 This means roughly 5% of homicides are justified, with Law Enforcement only contributing ~3% of fatalities. Put another way, law enforcement are ~32x less likely to commit homicide in the United States than by a private citizen.
Discrepancies in the FBI & CDC Data
Another important item to discuss is the discrepancy between the FBI & CDC data, both federal agencies.
The FBI only receives this data from reporting districts. While the vast majority (>90%) of districts report this information, it is not required by law. This enables districts with high murder rates to simply not to report the information to the FBI. In contrast, the hospitals have no incentive not to provide accurate information to the CDC. This enables comparison between the FBI to the CDC data to get an improved picture of the districts under reporting.
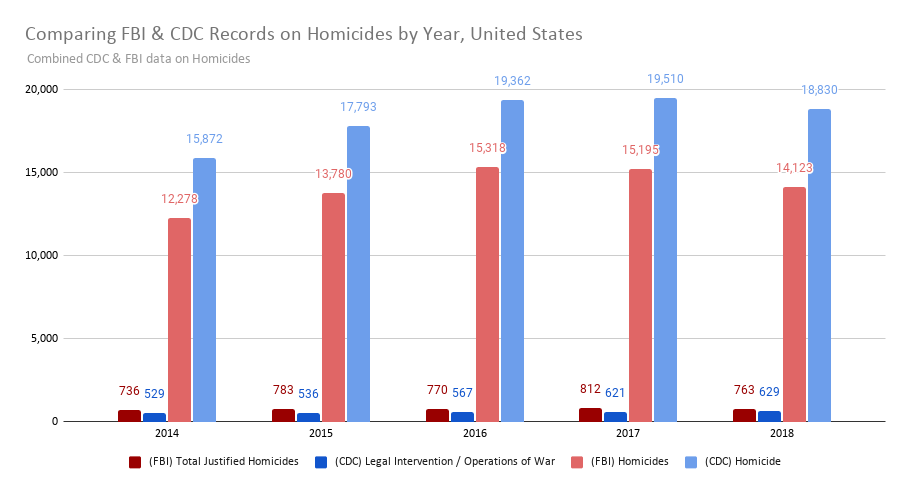 From the data, the CDC reports 30-35% more homicides than the FBI, and the FBI reports 20-30% more justified homicides. However, this makes sense the FBI would report a higher number of justified homicides as they’d be more likely to receive said outcomes than the CDC. Similarly, it makes sense the FBI doesn’t have all the homicide information. According to the FBI, (as of 2019) 41% of all federal, state, local, and tribal sworn officers participated in the data collection[3].
Closing Thoughts & Opinions
There is a lot of data & insights in this analysis.
The real question, did I answer the questions I set out to?
Are firearms inherently unsafe?
Should firearms be banned, as many believe?
Are firearms inherently unsafe?
No, it is not clear that firearms are inherently unsafe. Rather, the homicide rate is independent (or inversely proportional) to the firearm ownership rate. In short, firearms do not increase or decrease the overall “safety” of a community.
What would reduce the firearm homicide rate?
This is a difficult question to answer, most of the country uses guns very responsibly (see low accident rate).
By far, organized crime (i.e. gangs) are the largest group utilizing guns irresponsibly, so to make guns more safe — reduce gang membership.
- Focus on reducing gang activity
- Legalize less addictive / damaging drugs (e.g. marijuana), reducing gang income
- Convert the punishment mechanisms of state to treatment mechanisms
- Education and family support programs in gang ridden areas
- Increase community engagement & policing in gang ridden areas
Frankly, there’s a lot of material on how to improve communities. Generally, a heavy police presence & community engagement lowers crime, then businesses can move in and bring jobs. With jobs comes wealth and reduced reasons to join a gang.
Should firearms be banned, as many believe?
This is debatable, but I would argue no.
It is clear that eliminating firearms would not eliminate homicides. Further, there no evidence that reducing the overall number of firearms would impact homicide rate, as we have shown the homicide rate is independent of the firearm ownership rate.
On a practical level, it would also be impossible to remove all firearms. It’s easy enough to make firearms yourself and given the prevalence of firearms in the United States, it would take decades to remove firearms. Important for the United States, there’s also the right to firearm ownership in the constitution (the fabric of the nation) — meaning eliminating firearm ownership would be near impossible.
Should Assault Rifles be Banned?
Assault rifles, so often discussed by politicians and media outlets, are an insignificant contribution to the overall homicide rate. Handguns are used in >17x more homicides than all rifles (hunting, assault, etc). In my opinion, many people believe “no one needs an assault rifle,” making it an easy target by those already opposed to firearm ownership.
Firearms & Freedom in the United States
Above all, having firearms so widely available in the United States was by design. The “Founding Fathers” decided it was necessary to add it to the “Bill of [inalienable] Rights.” At the time, it made sense to protect firearms, but does it today? Arguably, the second amendment is still fulfilling its purpose today.
The Bill of Rights
For historical context regarding “the right to bear arms,” let’s read a speech by James Madison introducing the “Bill of Rights,”
First. That there be prefixed to the Constitution a declaration, that all power is originally vested in, and consequently derived from, the people.
That Government is instituted and ought to be exercised for the benefit of the people; which consists in the enjoyment of life and liberty, with the right of acquiring and using property, and generally of pursuing and obtaining happiness and safety.
That the people have an indubitable, unalienable, and indefeasible right to reform or change their Government, whenever it be found adverse or inadequate to the purposes of its institution
…
The people shall not be deprived or abridged of their right to speak, to write, or to publish their sentiments; and the freedom of the press, as one of the great bulwarks of liberty, shall be inviolable.
The people shall not be restrained from peaceably assembling and consulting for their common good; nor from applying to the legislature by petitions, or remonstrances for redress of their grievances.
The right of the people to keep and bear arms shall not be infringed; a well armed and well regulated militia being the best security of a free country: but no person religiously scrupulous of bearing arms shall be compelled to render military service in person.
James Madison and the revolutionaries which built the United States were doing so during the Enlightenment. From Madison’s statements, it’s clear the idea that government derived legitimacy from the people was critical.
In order to avoid tyranny, the government has to answer to the people.
The constitution, complexity of passing laws, the bill of rights; they exist to limit the descent into tyranny & create a society with protected rights.
Firearms Enable Freedom
It’s my opinion, retaining human rights is why firearms are important. In the United States, no group can fully suppress another. Unlike Russia, Iran, China, etc. in the United States, there are more firearms than people, half of the households own guns (orders of magnitude more than the military).
To illustrate why an armed populace is important we’ll take a look at Ireland. Prior to and during The Troubles in Ireland, the Irish Republican Army at its max strength was around 10,000 people. Yet, the IRA managed to negotiate with the United Kingdom (a much larger force), forcing the government to agree to terms (see Good Friday Agreement).
For this reason, (in the United States) it would be impossible for any group to meaningfully suppress another. United States citizens is too well armed to be either suppressed or subjected by the government.
Data & Tooling
Finally, for this analysis, the highest quality datasets were selected (where possible) — i.e. government data sources or reputable research institutions.
Datasets
Primary data sources for the United States:
- Center for Disease Control (CDC) – WONDER platform (Underlying Cause of Death(s))
- Federal Bureau of Investigation (FBI) – Crime Data Explorer (Homicide Information)
- United States Census Bureau (Population Data)
- National Gang Center, Nationalgangcenter.gov (Gang Demographics)
- RAND Corporation (Firearm Ownership Demographics)
- PEW Research, Social & Demographic Trends (Firearm Ownership Demographics)
Primary data sources for the globe:
- United Nations Office on Drugs and Crime
- Wikipedia – List of countries by firearm-related death rate
- Wikipedia – Small Arms Survey
Tools
Most of this analysis was done with simple spreadsheets, it’s messy, but I made three spreadsheets with all the data (from the datasets section).
- Firearm Analysis – World Wide
- Master Dataset Firearm Deaths – United States
- Firearm Related Deaths – United States
- Firearm Related Homicides – United States
The code which isn’t on the spreadsheets themselves are hosted on Github.
In the plot for “Deaths Associated with Firearm by Race” I assume hispanics are merged with whites?
From my observations one thing is clear: while there might be small genetic differences they are overshadowed by cultural differences completely.
The culture is passed on via parents -> parents make or break children.
While society can push them over the edge, this is much harder if the parents are understanding towards their children
and if both the mother and the father are present.
For those who wish to see that parents truly are at the core of this equations can read these two books by Alice Miller:
The Drama of the Gifted Child
The Body Never Lies: The Lingering Effects of Hurtful Parenting
So the problem is that shitty parents make shitty children -> then the shitty children make more shitty children and propagate this shitty culture which can lead to violence etc…
Living in poverty where you have no options but to sell drugs to eat combined with shit parents leads to a downward spiral
so these people cannot even imagine that there could be a better way out of their situtation.
> In the plot for “Deaths Associated with Firearm by Race” I assume hispanics are merged with whites?
That is true.
Regarding the rest, I think I had recommendations at the bottom.
For communities with challenges, I recommended a strong police presence, reduce prison time for drugs (instead treat the issue) and supporting family services. The police presence makes the environment safe for businesses to get started. Reduced drug charges & moving to treatment that’ll keep parents in the home. Finally, improving family services would reduce pressures on the home (free therapy or after school programs, for instance).
The goal is really to get the community safe & collected enough to get working and maintaining itself.