
This is a follow-up of the How I Made Over 100% YoY Profit Investing article, since I felt it was prudent to add some additional details.
Extraordinary claims require extraordinary evidence – Carl Sagan
Specifically, this article is on the backtesting results of the rudimentary (but still effective) algorithm currently on ProjectPiglet.com. Although back-testing has its problems (which I wrote about here), it’s often the best we can do.
While reviewing the strategies and results, it’s important to keep the following in mind:
- The algorithm being tested here is designed to be a value investing strategy
- It tends to beat the market by a significant percentage (often 40+%)
- This is a naive version of the strategy I personally employ (details below)
What’s Project Piglet?
Project Piglet is the code name for the project first described / mentioned on a blog post from 2014. The general idea, is that someone always knows — the question is: are they sharing what they know?
Turns out, they usually are.
Project Piglet utilizes the Metacortex platform to track several million online accounts, identifies the experts, then weighs their opinions about topics they discuss. Often, this leads to company insiders discussing confidential information on a public forum.
This patent pending algorithm is called ExpertRank, a method I developed. Where PageRank weights links based on how other pages, domains, or institutions link back. ExpertRank ranks people, their credibility, and ranks the content and people they discuss. The platform & my company is called Metacortex. The platform is employed in several live use cases (such as ProjectPiglet.com) and demos (HNProfile.com & RedditProfile.com).
Backtesting Configuration
The backtesting framework is rudimentary, but gets the job done and has the following characteristics:
- Python framework that pulls data from ProjectPiglet.com (Expert Opinion, Promoter Score, & Trend)
- Strategies can be tested simultaneously over a given time period
- Each strategy is given a “portfolio” containing a given amount of wealth and no positions
- The library can pull any of the following from ProjectPiglet.com, from 2007 – Today:
- Cryptocurrencies (Any)
- Stocks (NASDAQ, NYSE)
- Expert Opinion [Sentiment] (on any topic)
- Promoter Score (on any topic)
- Trends (on any topic)
- Various configurations can be setup, but typically only a subset of stocks are utilized due to the limited popular discussion (10, 25, 50 assets are often utilized for testing).
- Best results on time ranges (due to limited data), full range is 2007 – Today:
- 2009 – 2015
- 2016 – 2019
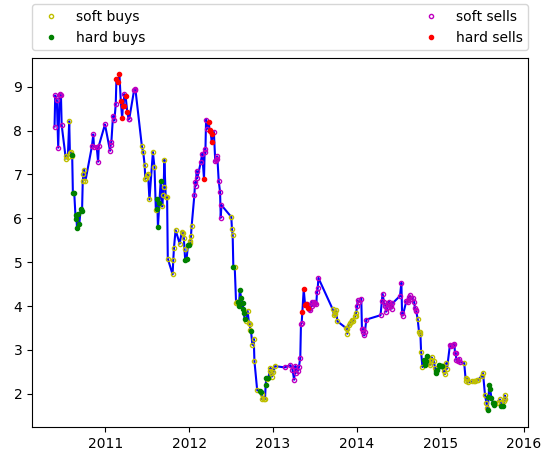
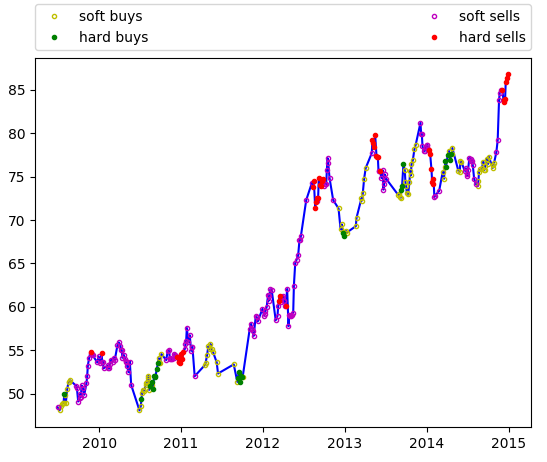
- All runs generate graphs of purchases and sales
- All runs generate graphs of recommendations [hard buy, soft buy, … etc.]
Investment Strategy
For our purposes, we cover three investment strategies:
- Buy & Hold – Buy at the first opportunity and never sell. This is the baseline model and is essentially representing an index fund.
- Piglet Strategy – Most details will be omitted, but it utilizes the Expert Opinion score to generate a prediction on stock movement.
- 10 Year U.S. Treasury Bonds – Considered highly safe investments, typically at 3% interest.
Buy & Hold Strategy
Description
The primary / base strategy is the buy & hold strategy. This is a test to ensure that the system is working and to use as a comparison against any model that is being tested.
Strategy
- Iterate over all assets at the first opportunity and purchase assets in an attempt to evenly distribute wealth
- Hold until end of trial (never sell)
Effectiveness
Overall, this strategy is highly effective for long-term investments, yielding results comparable with investing in an index fund.
Piglet Strategy
Description
This is the primary model that has been running since 2013 and would be considered our “challenger” model. Most details will be omitted (feel free to contact me).
Overall, this is an extremely naive model. The model always attempts to invest / sell the first time it sees an opportunity (it’s a “greedy algorithm”). Because of the greedy nature, limiting the assets to track make it more effective. From my standpoint, I always take the recommendations and see what is supporting the decision (typically insider discussion) and then will place the trade.
This shows the effectiveness of how a little extra data (expert opinion) can be utilized to improve profits. The current drawback is that it doesn’t predict prices across assets, so it doesn’t achieve the maximum possible gains.
Strategy
- Select assets that have enough data & are potentially vetted by a human
- Iterate over selected assets every new time period
- < Omitted >
- < Omitted >
- < Omitted >
- Sell if < Omitted >
Effectiveness
Without any human intervention, this method achieves between 30% – 40% YoY returns when using assets with enough data. Enough data, meaning there are enough experts discussing the topic(s) that we can make accurate predictions about price. The minimum number of experts discussing a topic, in order to be meaningful, is currently predicted at twelve.
Overall, this strategy is good at identifying when there’s an opportunity to sell and / or buy a given asset. However, cross asset decisions are simply done via a greedy algorithm (i.e. if you have funds and see a buy recommendation, place purchase). An improved algorithm can be used for comparing the market holistically; however, that is intentionally omitted from ProjectPiglet.com.
This strategy is designed to minimize potential losses and easy to compute on the fly. For assets that we have enough data to cover the time period, it will outperform the buy and hold strategy. Often, the results will be exceptionally good, especially with some minor human input (i.e. further interpreting the data).
 Utilizing this strategy (with slight modifications, along with judgment calls), I’ve effectively been able to garner >100% YoY returns for 5 years.
Backtesting Results
Now that we understand the strategies, we can get to the meat — backtesting!
Our dataset is limited for backtesting, to data we collected for ProjectPiglet.com.
With that in mind, we run a series of backtesting tests in various configurations (the same model for all tests):
- Small Test – Designed to minimize runtime and contain assets with a substantial number of expert opinions.
- Stagnant Test – Designed to minimize runtime and contain assets with a substantial number of expert opinions. In addition, we should see minimal increase in an asset’s wealth (likely a decline).
- Medium Test – Designed to have moderate runtime and contain assets with a substantial number of expert opinions.
- Large Test – Designed to contain many of the assets we have full coverage for in our backtesting dataset.
Our date-range for the backtesting will be: 2010 – 2015
Small Test
This configuration is designed to minimize runtime and select assets with the highest likelihood of having substantial coverage from the expert opinion section.
Date Range: 2010-01-01 to 2015-10-13
Total Assets: 11
Piglet Strategy
Dates Assessed: 2010-01-01 through 2015-10-13
Total Investment: $100,000.00
Total Assets: $328,052.26
End Profits: $228,052.26
Returns: 228.05 % (3.28x)
Yearly Amortized Gains: 45.61 %
Associated Trades: Piglet-Small-Trades
Buy & Hold Strategy
Dates Assessed: 2010-01-01 through 2015-10-13
Total Investment: $100,000.00
Total Assets: $168,997.60
End Profits: $68,997.60
Returns: 69.00 % (1.69x)
Yearly Amortized Gains: 13.80 %
Associated Trades: Buy&Hold-small-Trades
10 Year U.S. Treasury Bonds
Dates Assessed: 2010-01-01 through 2016-01-01
Total Investment: $100,000.00
Total Assets: $119,231.00
End Profits: $19,231.00
Returns: 19.00 % (1.19x)
Yearly Amortized Gains: 3.20 %
Associated Trades: Treasury-bonds
Small Test | Asset List
| Asset Type | Asset | Expert Opinion Term |
| Company | AMD | amd|ryzen|vega |
| Company | GOOGL | google|android|gmail |
| Company | AMZN | amazon|aws |
| Company | AAPL | apple|ios |
| Company | MSFT | microsoft|windows |
| Company | FB | |
| Company | TSLA | tesla |
| Company | ADBE | adobe |
| Company | NVDA | nvidia |
| Company | INTC | intel|i7 |
| Company | ORCL | oracle |
Small Stagnant Test
This configuration is designed to minimize runtime and select assets with the highest likelihood of having substantial coverage from the expert opinion section. In addition, we should see virtually no increase in an asset’s wealth (likely a decline)
Date Range: 2010-01-01 to 2015-10-13
Total Assets: 10
Piglet Strategy
Dates Assessed: 2010-01-04 through 2015-10-13
Total Investment: $100,000.00
Total Assets: $137,829.36
End Profits: $37,829.36
Returns: 37.83 % (1.38x)
Yearly Amortized Gains: 7.57 %
Associated Trades: Piglet-stagnant-Trades
Buy & Hold Strategy
Dates Assessed: 2010-01-04 through 2015-10-13
Total Investment: $100,000.00
Total Assets: $91,104.53
End Profits: -$8,895.47
Returns: -8.90 % (0.91x)
Yearly Amortized Gains: -1.78 %
Associated Trades: Buy&Hold-stagnant-Trades
10 Year U.S. Treasury Bonds
Dates Assessed: 2010-01-01 through 2016-01-01
Total Investment: $100,000.00
Total Assets: $119,231.00
End Profits: $19,231.00
Returns: 19.00 % (1.19x)
Yearly Amortized Gains: 3.20 %
Associated Trades: Treasury-bonds
Stagnant Test | Asset List
| Asset Type | Asset | Expert Opinion Term |
| Company | AMD | amd|ryzen|vega |
| Company | QCOM | qualcomm |
| Company | HPQ | hp |
| Company | TWTR | |
| Company | GRPN | groupon |
| Company | VMW | vmware |
| Company | MON | monsanto |
| Company | CTL | centurylink |
| Company | XRX | xerox |
| Company | SNE | sony|ps4 |
Medium Test
This configuration is designed to also minimize runtime and select assets with the highest likelihood of having substantial coverage from the expert opinion section. However, add different asset classes, such as cryptocurrencies. Model configuration is unchanged.
Date Range: 2010-01-01 to 2015-10-13
Total Assets: 23
Piglet Strategy
Dates Assessed: 2010-01-01 through 2015-10-13
Total Investment: $100,000.00
Total Assets: $263,815.26
End Profits: $163,815.26
Returns: 163.82 % (2.64x)
Yearly Amortized Gains: 32.76 %
Associated Trades: Piglet-medium-Trades
Buy & Hold Strategy
Dates Assessed: 2010-01-01 through 2015-10-13
Total Investment: $100,000.00
Total Assets: $179,846.02
End Profits: $79,846.02
Returns: 79.85 % (1.80x)
Yearly Amortized Gains: 15.97 %
Associated Trades: Buy&Hold-medium-Trades
10 Year U.S. Treasury Bonds
Dates Assessed: 2010-01-01 through 2016-01-01
Total Investment: $100,000.00
Total Assets: $119,231.00
End Profits: $19,231.00
Returns: 19.00 % (1.19x)
Yearly Amortized Gains: 3.20 %
Associated Trades: Treasury-bonds
Medium Test | Asset List
| Asset Type | Asset | Expert Opinion Term |
| Company | AMD | amd|ryzen|vega |
| Company | GOOGL | google|android|gmail |
| Company | AMZN | amazon|aws |
| Company | AAPL | apple|ios|mac |
| Company | MSFT | microsoft|windows |
| Company | FB | facebook|oculus|instagram |
| Company | TSLA | tesla |
| Company | ADBE | adobe |
| Company | NVDA | nvidia |
| Company | INTC | intel|i7|skylake |
| Company | ORCL | oracle |
| Company | C | cisco |
| Company | IBM | ibm |
| Company | VZ | verizon |
| Company | TMUS | tmobile |
| Company | CMCSA | comcast |
| Company | QCOM | qualcomm |
| Company | HPQ | hp |
| Company | TWTR | |
| Company | GRPN | groupon |
| Company | CRM | salesforce |
Large Test
This configuration is designed to contain multiple stocks, which the Metacortex Platform would likely contain data on.
Date Range: 2010-01-01 to 2015-10-13
Total Assets: 43
Piglet Strategy
Dates Assessed: 2010-01-01 through 2015-10-13
Total Investment: $100,000.00
Total Assets: $298,771.80
End Profits: $198,771.80
Returns: 198.77 % (2.99x)
Yearly Amortized Gains: 39.75 %
Associated Trades: Piglet-large-Trades
Buy & Hold Strategy
Dates Assessed: 2010-01-01 through 2015-10-13
Total Investment: $100,000.00
Total Assets: $205,693.42
End Profits: $105,693.42
Returns: 105.69 % (2.06x)
Yearly Amortized Gains: 21.14 %
Associated Trades: Buy&Hold-large-Trades
10 Year U.S. Treasury Bonds
Dates Assessed: 2010-01-01 through 2016-01-01
Total Investment: $100,000.00
Total Assets: $119,231.00
End Profits: $19,231.00
Returns: 19.00 % (1.19x)
Yearly Amortized Gains: 3.20 %
Associated Trades: Treasury-bonds
Large Test | Asset List
| Asset Type | Asset | Expert Opinion Term |
| company | AMD | amd|ryzen|vega |
| company | GOOGL | google|android|gmail|chrome |
| company | AMZN | amazon|aws|ec2 |
| company | AAPL | apple|ios|mac|osx |
| company | MSFT | microsoft|windows |
| company | FB | facebook|instagram|whatsapp |
| company | TSLA | tesla|roadster|model 2|model 3 |
| company | ADBE | adobe|photoshop |
| company | NVDA | nvidia |
| company | INTC | intel|i7|i5|skylake |
| company | ORCL | oracle |
| company | CSCO | cisco |
| company | IBM | ibm |
| company | VZ | verizon|fiber |
| company | TMUS | tmobile |
| company | CMCSA | comcast |
| company | QCOM | qualcomm |
| company | HPQ | hp |
| company | TWTR | |
| company | GRPN | groupon |
| company | CRM | salesforce|heroku |
| company | RHT | red hat |
| company | GS | goldman |
| company | NFLX | netflix |
| company | AVGO | broadcom|asus |
| company | VMW | vmware|vm |
| company | ADSK | autodesk |
| company | LMT | lockheed |
| company | BA | boeing|737|777 |
| company | WMT | walmart |
| company | EBAY | ebay |
| company | FDX | fedex |
| company | UPS | ups |
| company | COKE | coke |
| company | MON | monsanto |
| company | GRUB | grubhub |
| company | LUV | southwest |
| company | UAL | united airlines |
| company | TXN | ti|calculator |
| company | CTL | centurylink |
| company | EMCI | emc|dell |
| company | xrx | xerox |
| company | SNE | sony|ps4 |
Analyzing the Results
It’s clear above, the method Piglet Strategy is consistently ahead of the basic buy & hold strategy in backtesting. This matches my results from my live investments, where I made significant gains for the past several years (200% in 2018).
Unfortunately, as I’ve mentioned before there’s no guarantee that will continue. If the efficient-market hypothesis is to be believed, eventually the market will fully reflect available information. Currently, Metacortex gives ProjectPiglet.com (and me), but at some point that should no longer be the case — just doesn’t appear to be today.
If you’re interested in working with me or licensing my system. Please, contact me.