
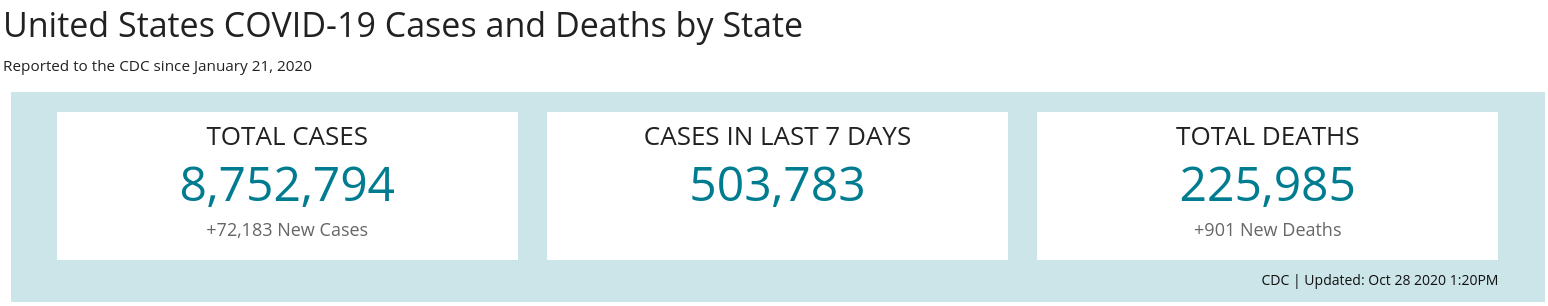
In August, I made the prediction that it’s likely we’ll see 250,000 dead officially by October 14 and the unofficially death count closer to 500,000 to 800,000 from COVID-19.
According to official data, my prediction was inaccurate, being closer to the lower bound of my simulation(s).
The CDC currently (October 28, 2020) are now 226,000.
Why was I off? It appears the virus was suppressed relatively well August and September in 2020. Below you can see the US deaths per week of the year (from the CDC Excess Deaths data) for the last five years:
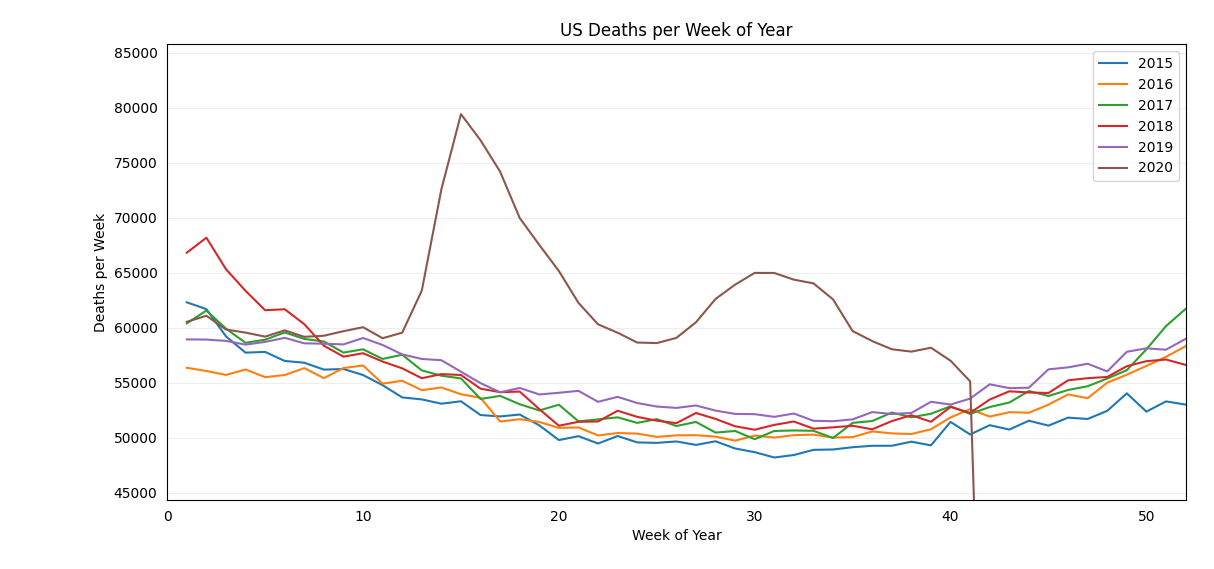 Clearly, it looks like there were two waves and it also looks like it’s about to pick up (a third wave). Note, the data is most up-to-date the week of Monday 2020-09-21, it’s likely much higher (four weeks later).
COVID-19 Death Estimates
In terms of current COVID-19 deaths, although the official numbers from the CDC are 226,000; I suspect it’s closer to 300,000 to 330,000 deaths. Below are a few of the predictions for the deaths in week 40 (beginning Sept 28, 2020) of 2020 (note: week 40 doesn’t have total counts):
- 1 standard deviation above the 5 year average: 126,334.37
- 0.68 standard deviation above 5 year average: 201,221.17
- Deaths over regression prediction(s): 264,521.50
- Deaths over 2019: 310,598.00
See the regression of U.S. deaths by year charted below:
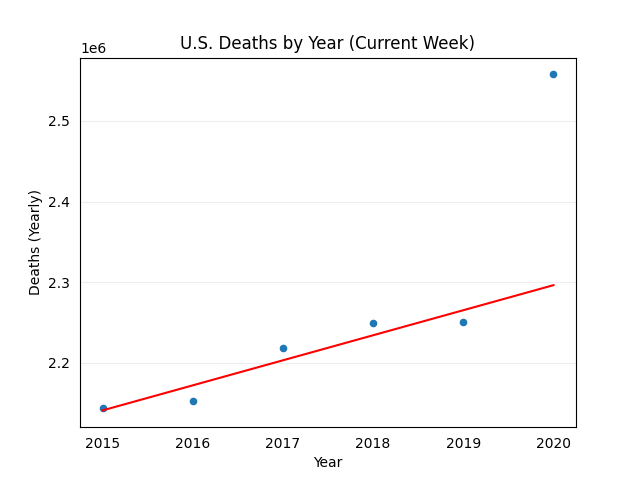 From the chart(s) and the data it’s clear we should at the very least be above the official 226,000 COVID-19 related deaths. It’s also a fair assumption that many deaths have occurred since week 40, at the time I’m writing this it’s the 44th week of the year.
Increasing Infection & Death Rates
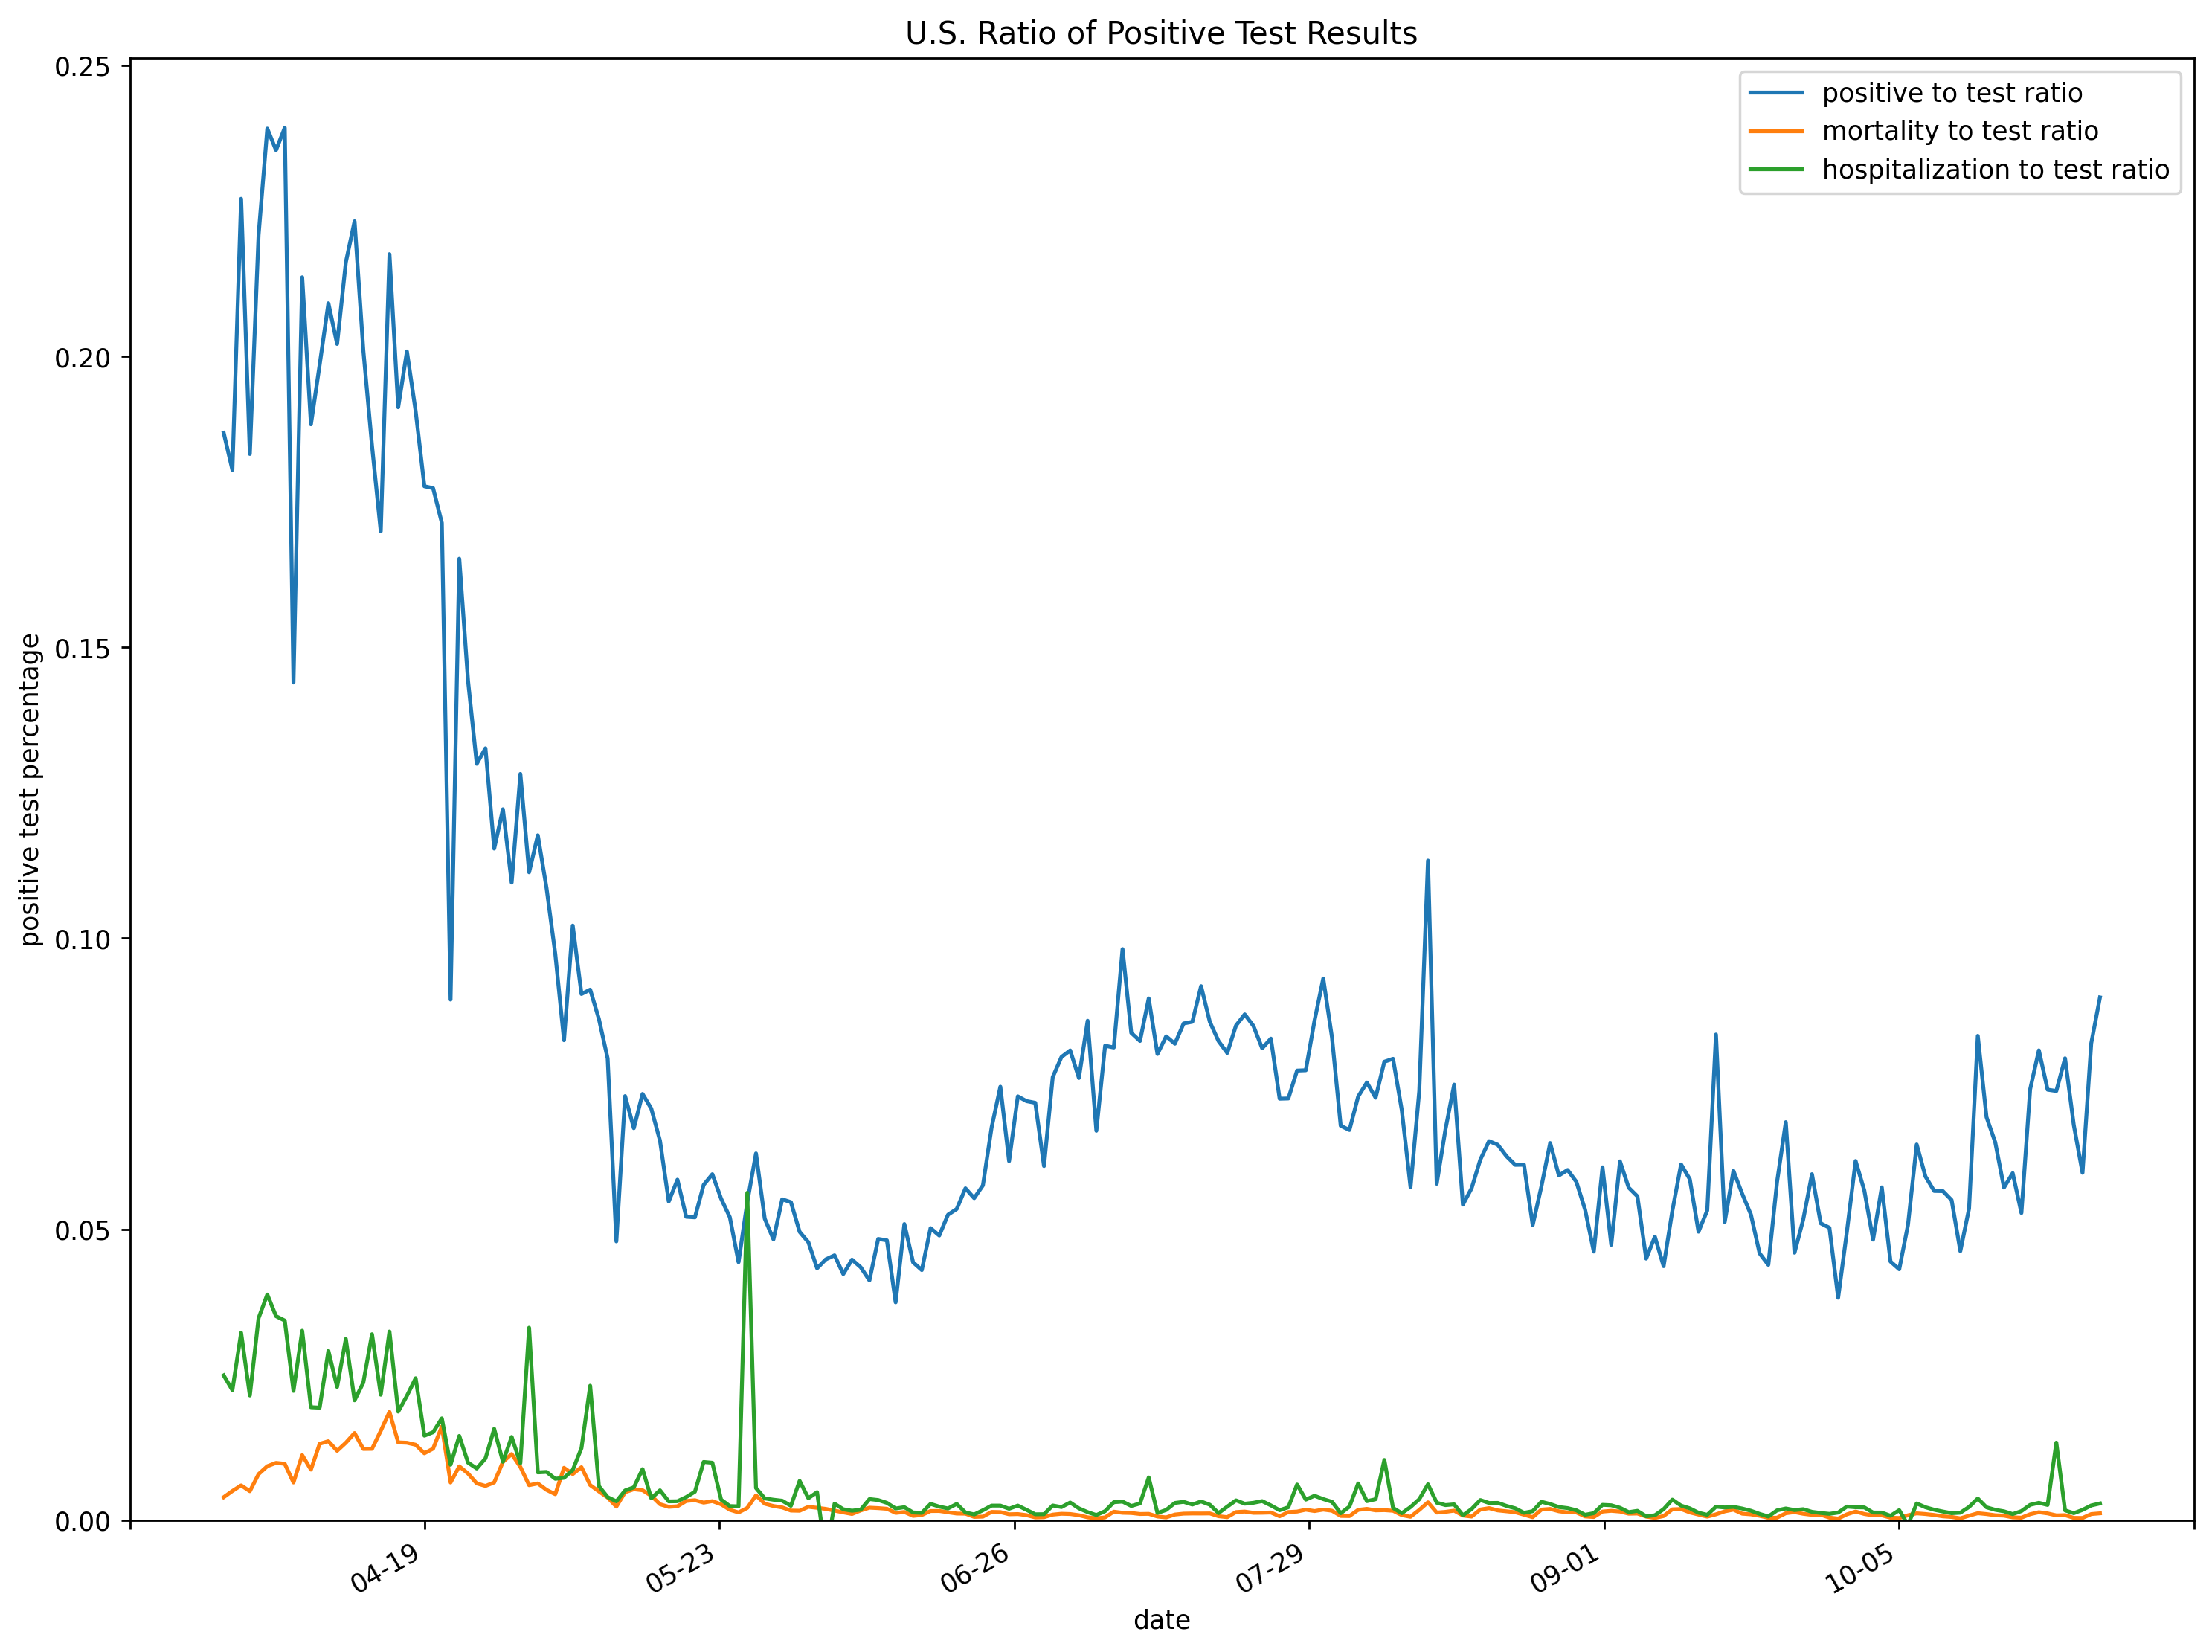
As some of the media outlets have shared, COVID-19 cases are on the rise. How significant? It appears the hospitalization rate is back to where it was in June 2020.
 At the same time there’s increased positives and new hospitalization rates. There’s also an increase in the positivity rate, which again appears to be growing exponentially.
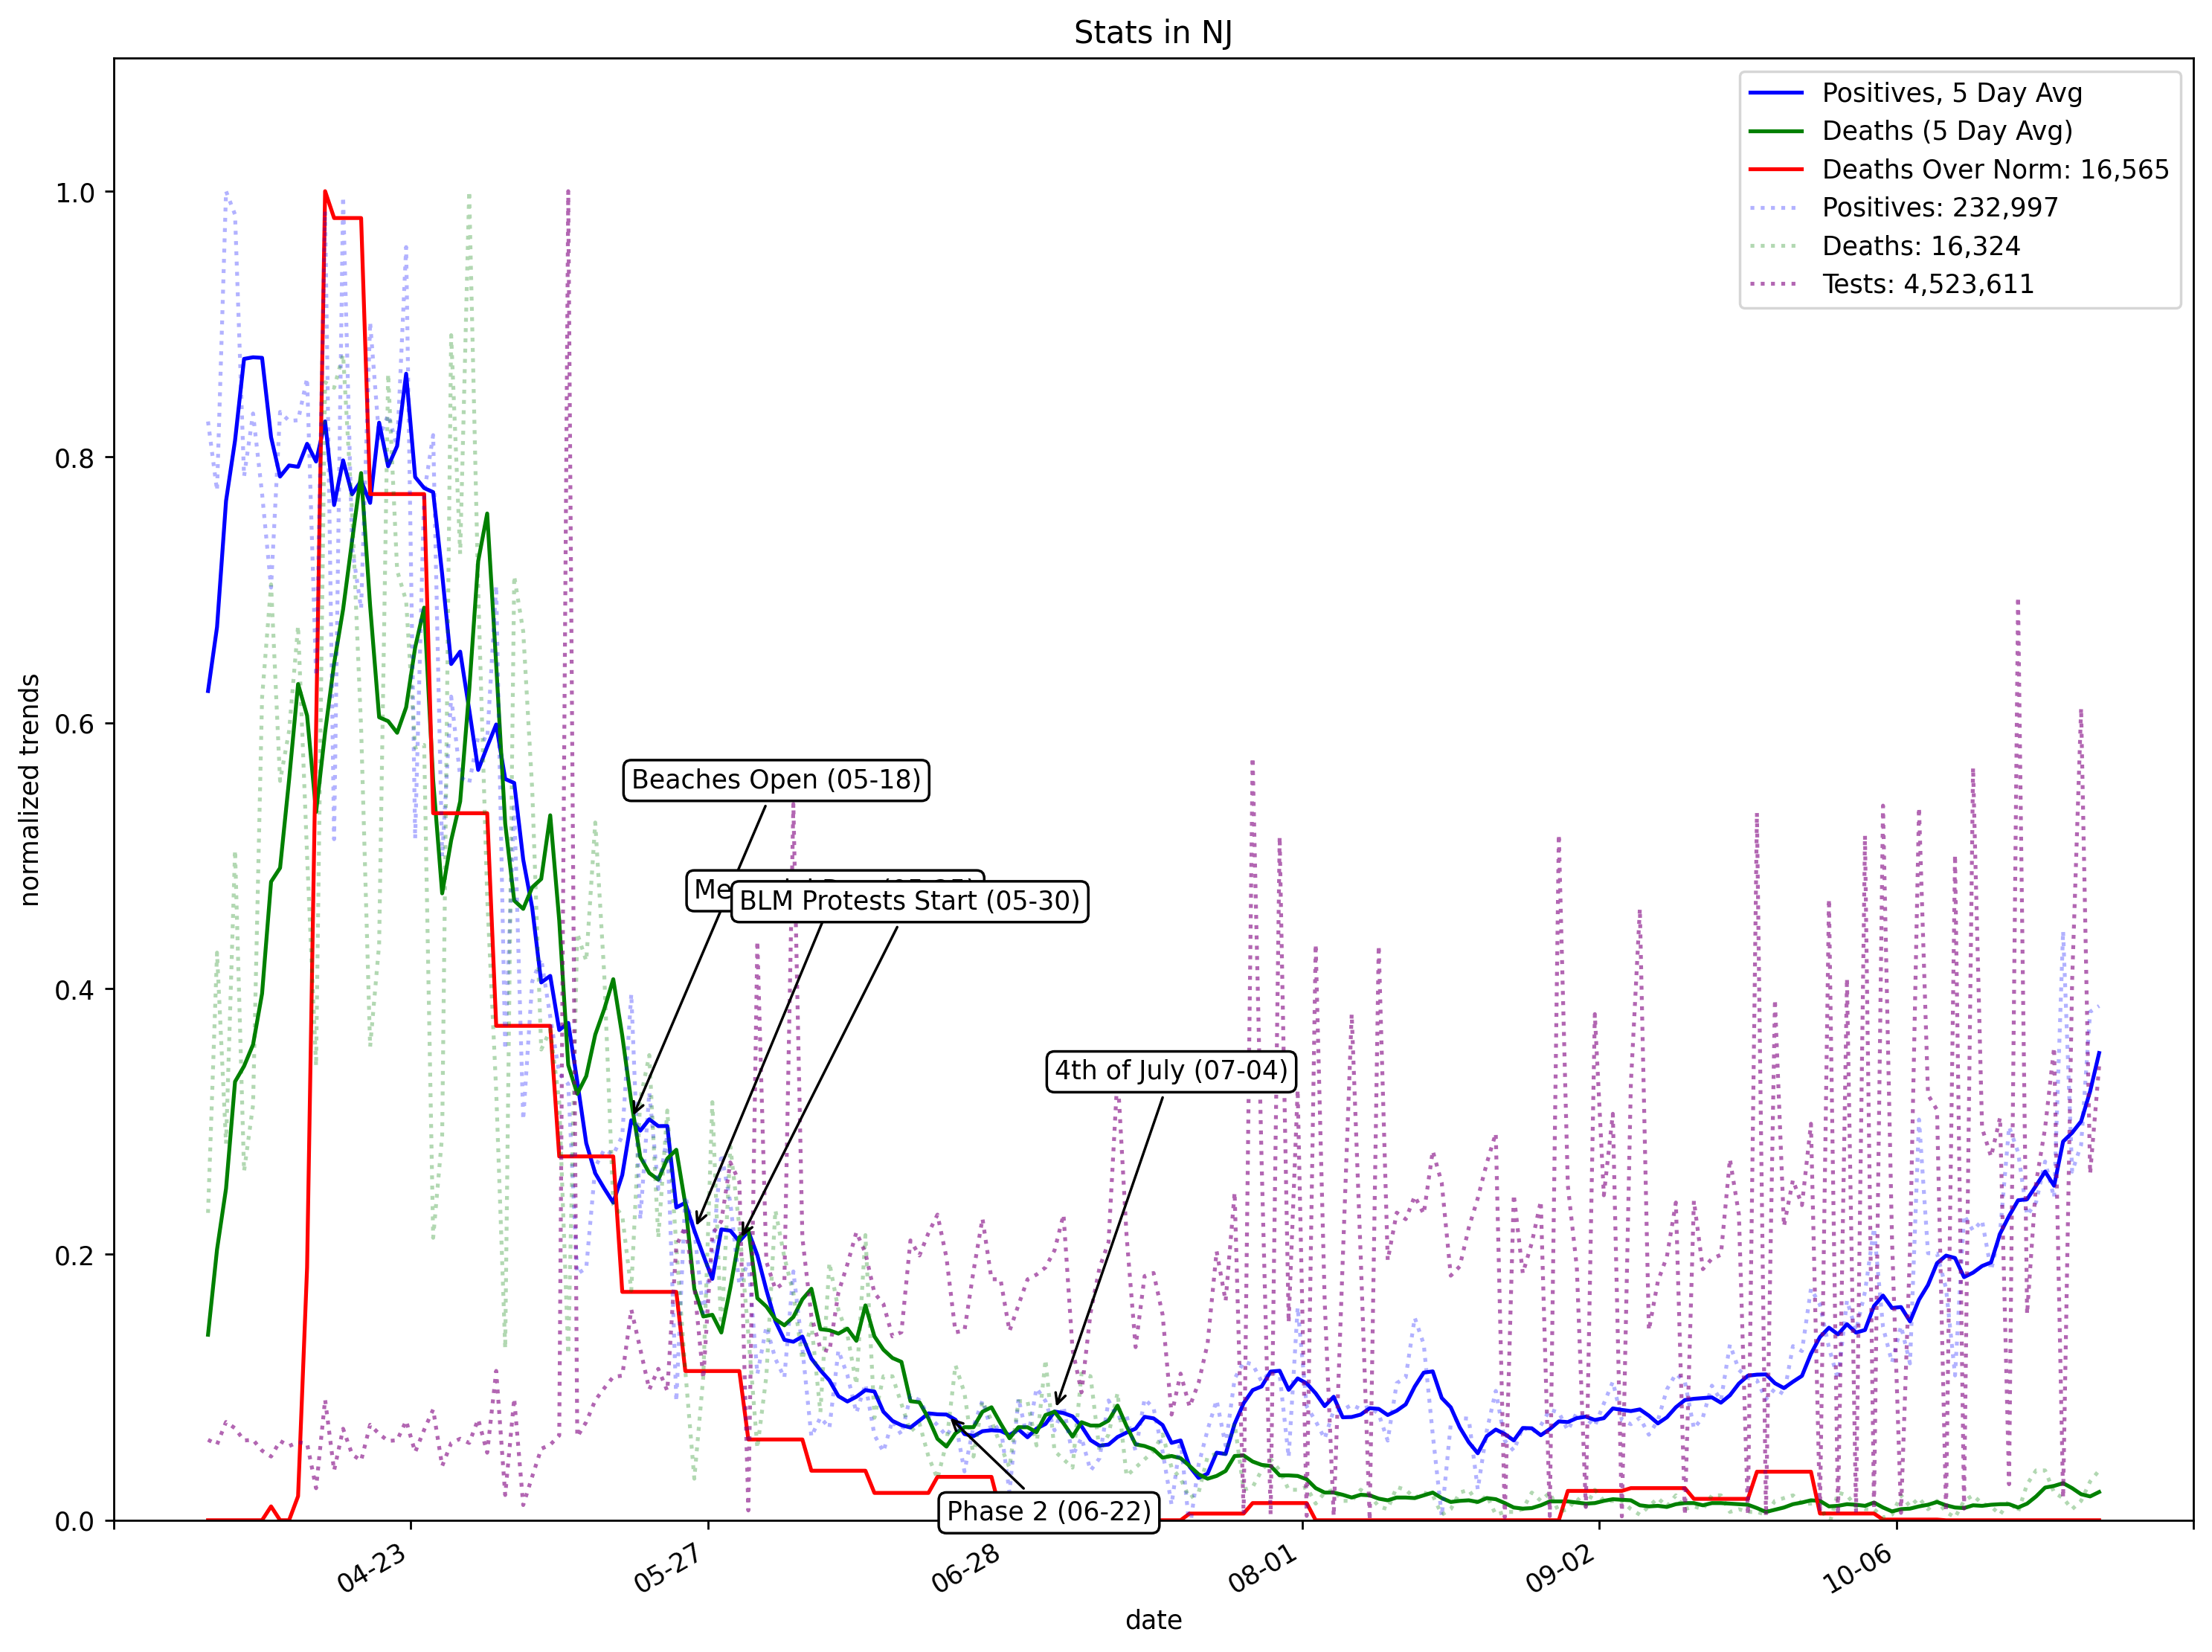
 In terms of what this means — It looks like lock-downs are being ignored or are ineffective. With the cooler weather, I suspect everyone is going inside and getting close enough to spread the virus. Below is New Jersey which has stayed relatively locked down the entire time.
Illinois, which has loosened restrictions and is even worse:
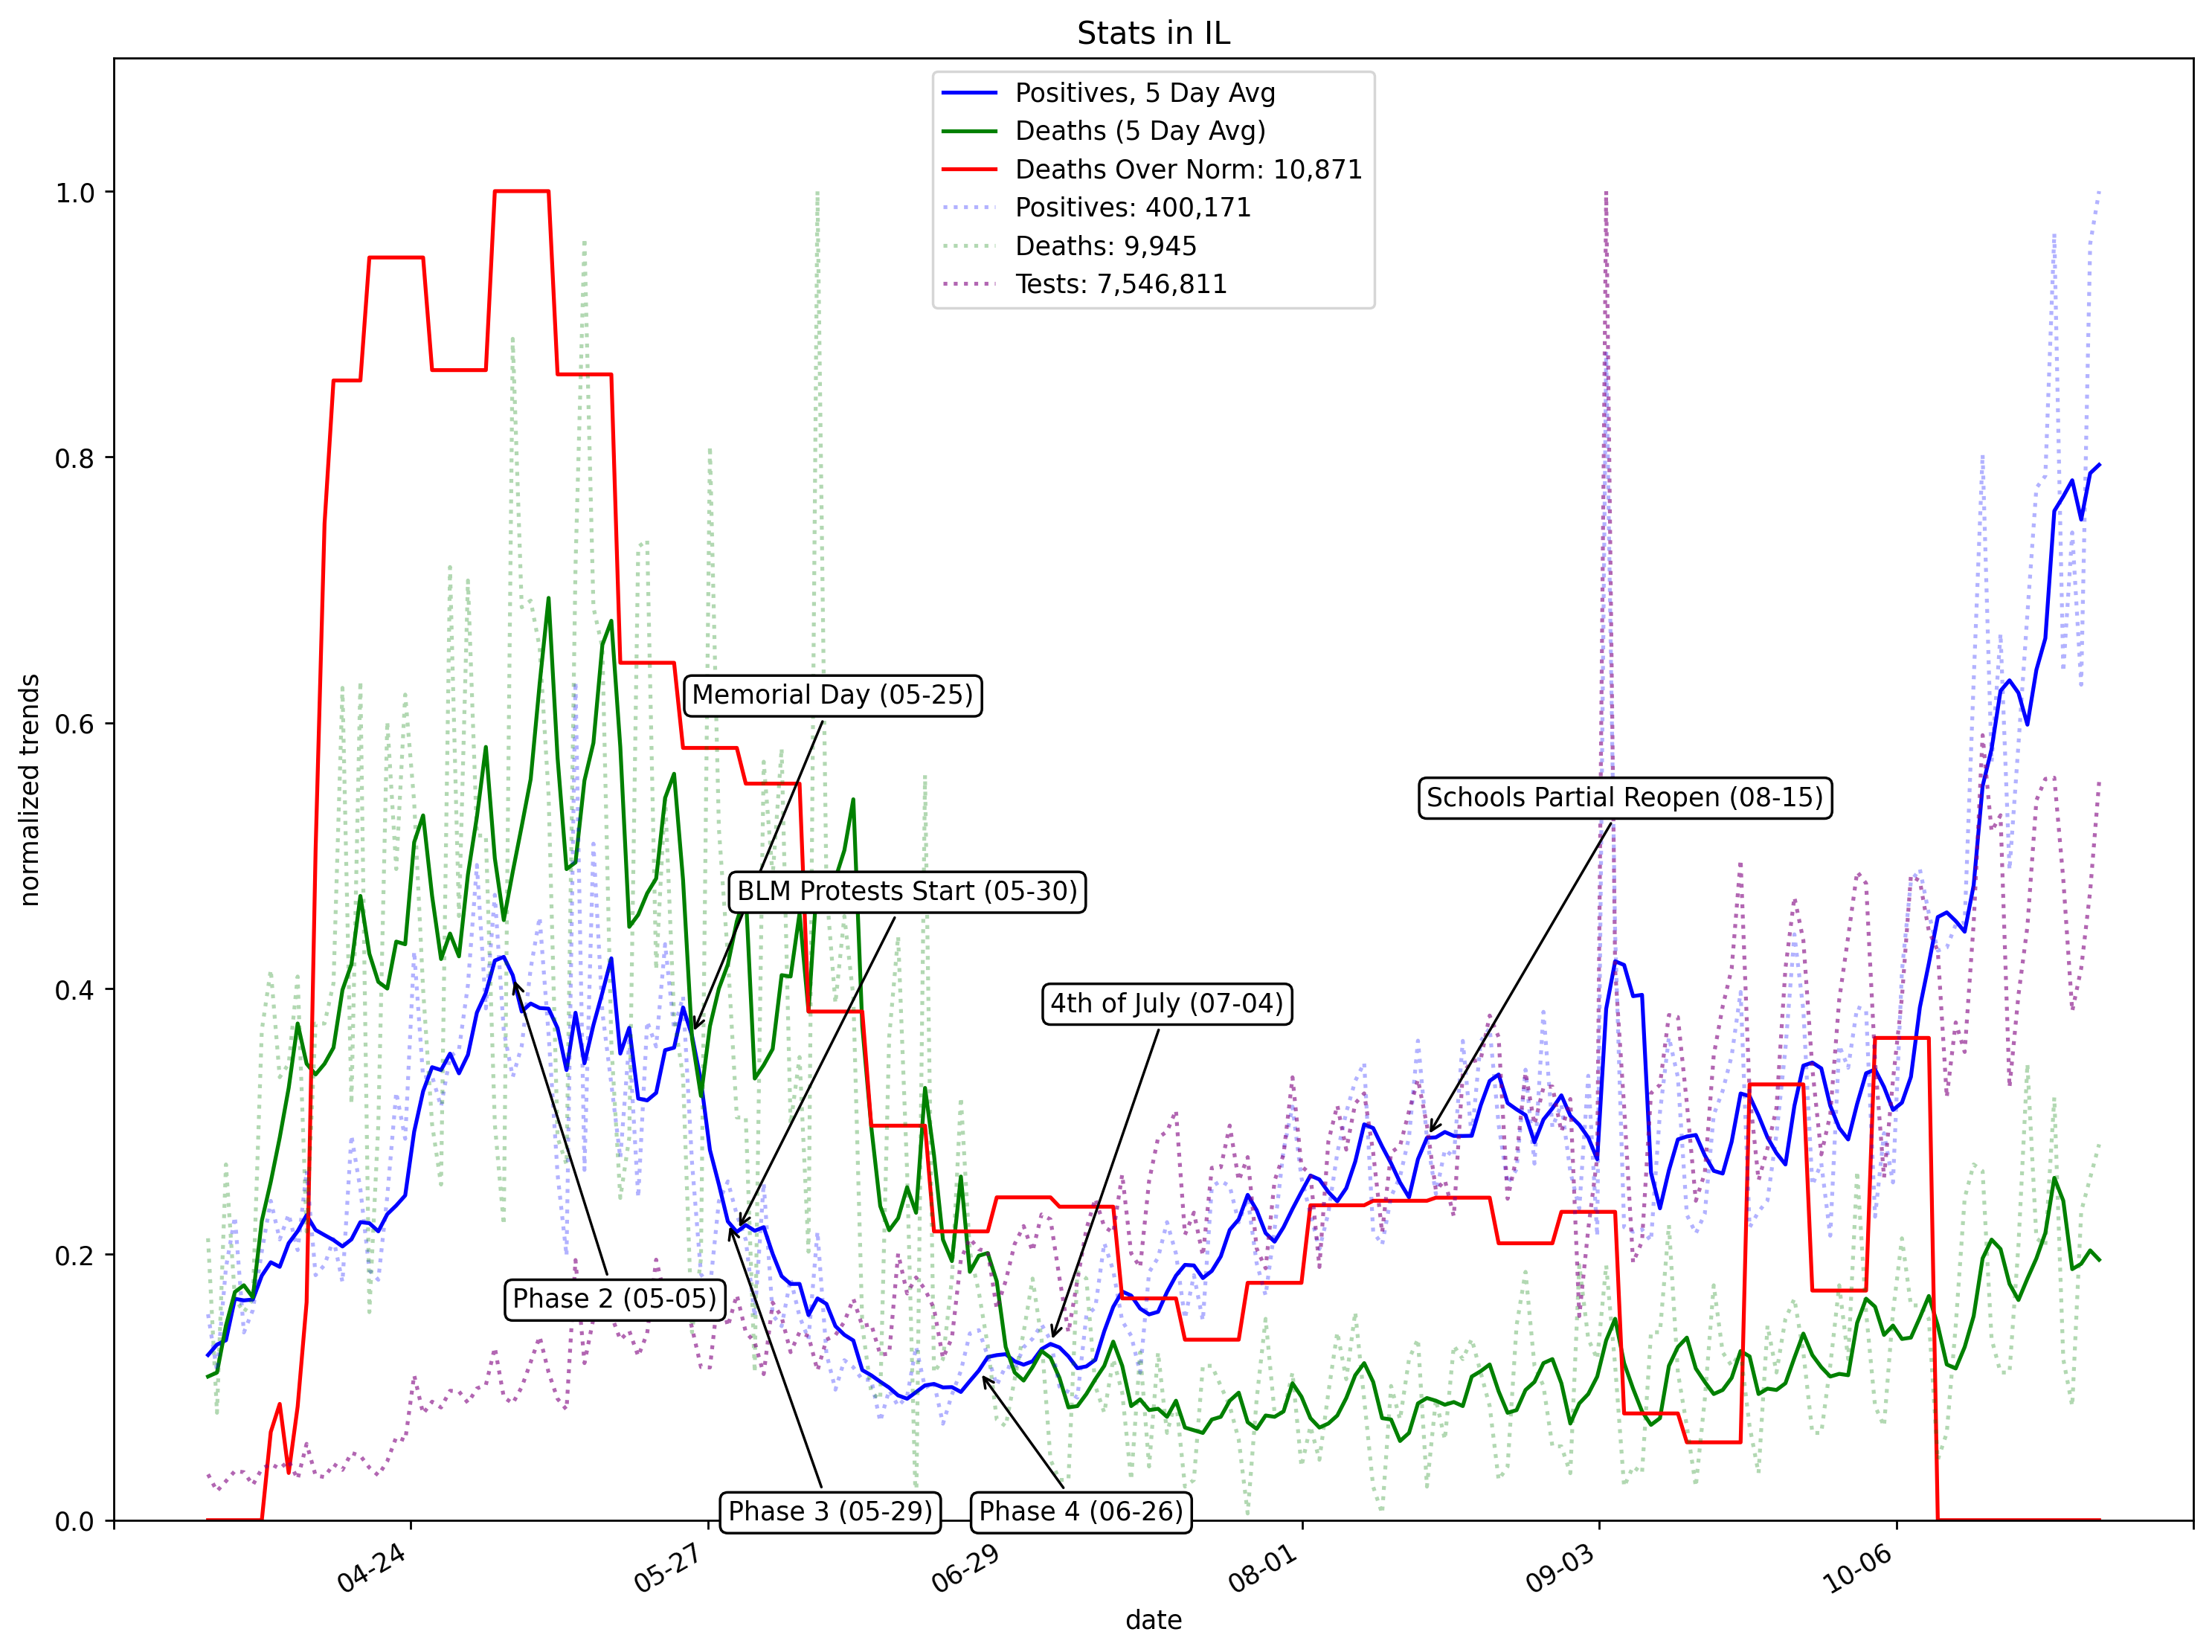 From the charts, it’s clear the infections in these states have something around a 14 day (or less) doubling rate.
Predicting COVID-19 Deaths
Being eight months into the pandemic, hopefully we have more accurate information. Assuming our data is accurate, upon review, I think it’s time to reduce the expected death tolls (at least on this blog). The data & models reviewed are currently indicating 325,000 to 600,000 COVID-19 related deaths by the end of 2020.
IHME, University of Washington
The University of Washington’s Institute for Health Metrics and Evaluation (IHME) COVID-19 model has been widely cited, including by the current Trump administration. However, it’s important to know the context that the model has also been notoriously under-predicting the fatalities by COVID-19[1][2][3].
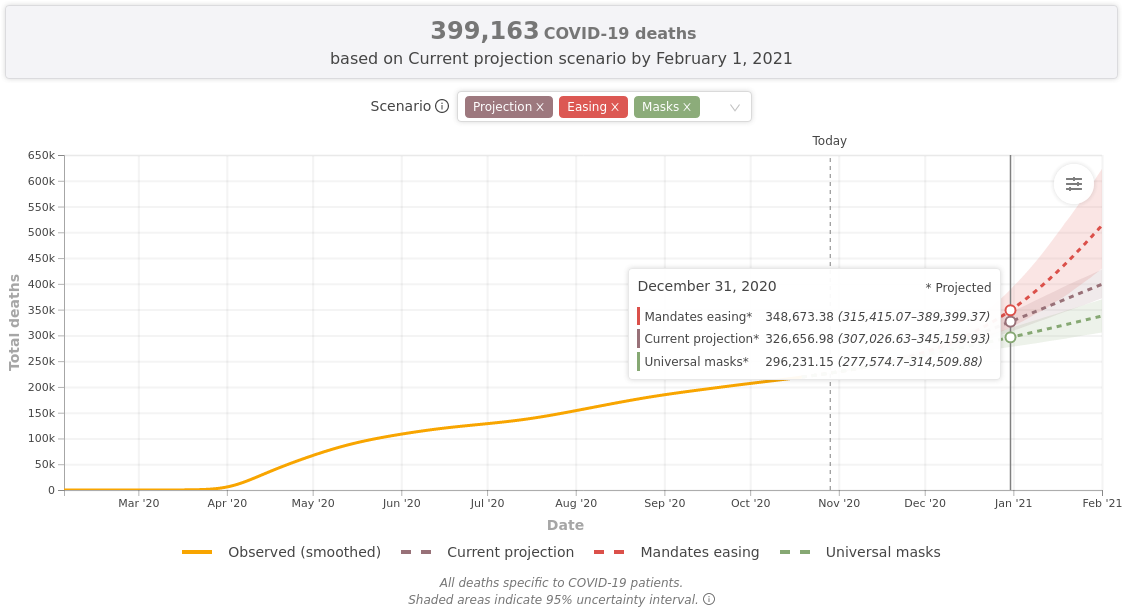
Based on the IHME model, we can expect 307,000 to 345,000 deaths from COVID-19 or 0.1% of the United States population by the end of 2020. Even with easing mandates, we’re only looking at 315,000 to 389,000 or 0.12% of the United States population, based on their simulation(s). Frankly, their predicted number of COVID-19 related deaths seems lower than one might expect. Mentioned previously, as of the 1st week of October there are already ~300,000 more deaths:
Deaths over regression prediction(s): 264,521.50
Deaths over 2019: 310,598.00
That being said, given how inaccurate this model has been thus far, we can assume a higher death count.
Biozentrum, University of Basel
The model that I have been using (really a simulation), which allows users to configure different scenarios is produced by the University of Basel. Current projections, based on what I entered, are some where around 500,000 COVID-19 related fatalities by the end of 2020.
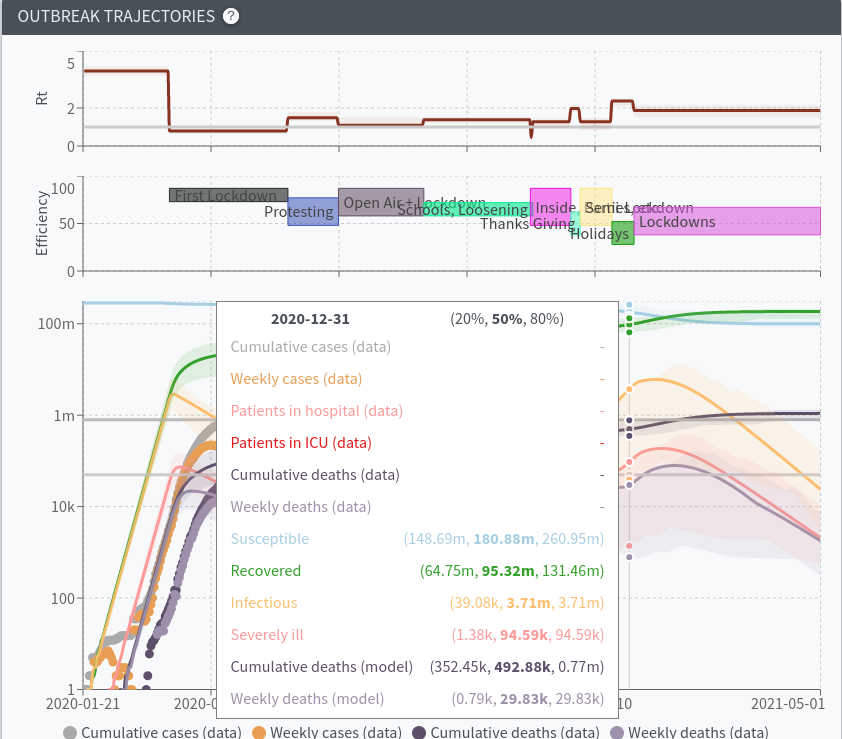
To be honest, take this worth a grain of salt. The last simulation was pretty far off, predicting around 800,000 deaths by Oct 15. However, it’s important to note, it’s very difficult to predict how well school openings would go, etc. It appears better precautions were taken than I expected, resulting in lower spread (and deaths). As it stands, most schools are closed, fully-remote or part time with heavy cleaning between isolated classes.
Today, I expect this model to be more accurate. I am now assuming social distancing will only loosen for the holidays, regardless of government intervention. I also suspect moving into November we’ll see tighter restrictions and closing most of the remaining schools. If true, expecting 500,000 COVID-19 related deaths would be equivalent to 0.15% by the end of 2020. By March 15, 2021, we could expect 1,000,000+ COVID-19 deaths related to COVID-19 (or 0.3% of the population).
Extrapolation from COVID-19 Tracker, John Hopkins
In addition to the two modeling approaches above, I did some of my own extrapolating.
The methodology was very rudimentary :
- Take random highly populated counties throughout the United States
- Expect infections cannot reoccur in the same year
- Assume for every positive test there are 8 not reported (consensus appears to be all over the place [1])
- Assume for every 1 death, there are 0.5 additional deaths unaccounted for
- 65% infection rate is the minimum number infected within 12 months
- 100% infection rate is the minimum number infected within 12 months
My personal thought on this is that by sampling the counties I could get the appropriate fatality rate. Currently, the COVID-19 fatality rate is sitting around 0.6%, with the assumptions above. Even if we assume tests cover 100% of the cases (i.e. no under reporting), there would still only be a 1% fatality rate.
In terms of what that means in terms of numbers, by the end of 2020 I’d expect something similar to the following numbers:
- 100% Infection rate, by year end – 593,672 deaths by end of 2020
- 80% Infection rate, by year end – 474,938 deaths by end of 2020
- 65% Infection rate, by year end – 385,887 deaths by end of 2020
See full analysis here.
That puts the projection right around 400,000 deaths by the year end (0.12% of overall population), as I’d expect a 65-70% infection rate by that point. The reality is people will have parties, election riots, holidays, etc. all of which will lead to mixing and mingling. It seems reasonable to suspect 65-70% of people will catch COVID-19. Further, it’s also possible overwhelmed hospitals will contribute further to the deaths.
By this analysis we can probably expect ~633,000 COVID-19 related deaths (min: 514,516 to max: 791,563 COVID-19 related deaths) around March 15, 2021.
COVID-19 Predicted Fatality Rate
I think it’s important to highlight the overall death rate by the end of 2020:
- IHME, University of Washington – 325,000 COVID-19 deaths or 0.1% deaths of overall population
- Biozentrum, University of Basel – 500,000 COVID-19 deaths or 0.15% deaths of overall population
- Extrapolation from COVID-19 Tracker, John Hopkins – 400,000 COVID-19 deaths or 0.12% deaths of overall population
Consensus appears to be around 400,000 deaths by the end of the year. By March 15, 2021 we can predict 600,000 to 1,000,000 COVID-19 deaths or (0.18% to 0.3% of the population). Why does this matter? That death rate is inline with the overall flu fatality rate. The predicted COVID-19 fatality rate seems to be around 0.24% (based on the John Hopkins data).
For reference, the flu fatality rate is around 0.018% (Influenza & Pneumonia in 2018)[4], that leaves COVID-19 being 10x more fatal (for the year). However, when we compare to cancer around 150 to 200 per 100,000 inhabitants in the United States die per year[5], this equates to 0.15% to 0.2% deaths by cancer a year — similar to COVID-19.
To be clear,
The predicted COVID-19 fatality rate appears to be similar to the cancer fatality rate.
It should be noted, that’s only true provided the hospital system doesn’t get overwhelmed; if the hospital system does become over whelmed the fatality rate will increase.
The Economy
With the given fatality rate in mind, a “lock-down” does not appear like it is a good strategy any longer. Even if 1% of the U.S. population died this year, at this point the lock downs are destroying the economy, businesses and lives. If we look at the unemployment data from the U.S. Government, those unemployed for 15 weeks or over are 4x higher than 2019.
The full table is below:
| Measure | Not seasonally adjusted | Seasonally adjusted | |||||||
|---|---|---|---|---|---|---|---|---|---|
| Sept. 2019 |
Aug. 2020 |
Sept. 2020 |
Sept. 2019 |
May 2020 |
June 2020 |
July 2020 |
Aug. 2020 |
Sept. 2020 |
|
|
U-1 Persons unemployed 15 weeks or longer, as a percent of the civilian labor force |
1.3 | 5.0 | 4.5 | 1.3 | 1.4 | 2.1 | 5.0 | 5.1 | 4.6 |
|
U-2 Job losers and persons who completed temporary jobs, as a percent of the civilian labor force |
1.4 | 6.4 | 5.5 | 1.6 | 11.6 | 8.9 | 8.1 | 6.4 | 5.7 |
|
U-3 Total unemployed, as a percent of the civilian labor force (official unemployment rate) |
3.3 | 8.5 | 7.7 | 3.5 | 13.3 | 11.1 | 10.2 | 8.4 | 7.9 |
|
U-4 Total unemployed plus discouraged workers, as a percent of the civilian labor force plus discouraged workers |
3.5 | 8.8 | 8.0 | 3.7 | 13.6 | 11.5 | 10.6 | 8.7 | 8.2 |
|
U-5 Total unemployed, plus discouraged workers, plus all other persons marginally attached to the labor force, as a percent of the civilian labor force plus all persons marginally attached to the labor force |
4.1 | 9.7 | 8.8 | 4.3 | 14.6 | 12.5 | 11.3 | 9.6 | 8.9 |
|
U-6 Total unemployed, plus all persons marginally attached to the labor force, plus total employed part time for economic reasons, as a percent of the civilian labor force plus all persons marginally attached to the labor force |
6.5 | 14.3 | 12.4 | 6.9 | 21.2 | 18.0 | 16.5 | 14.2 | 12.8 |
That being said, I’m not 100% convinced these numbers are correct. There are around 164.6 million persons in the Untied States labor force[6] and well over 60 million have filed for unemployment benefits since the COVID-19 pandemic started[7].
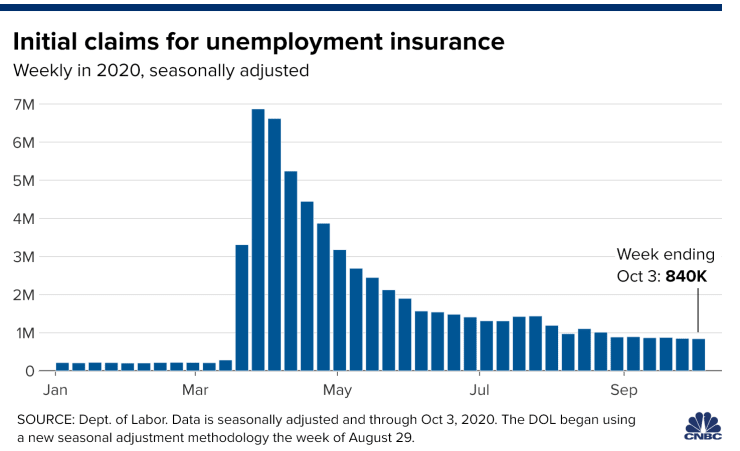
Above are the initial job claims (i.e. first time filing unemployment this year) and in this case, again we see 64 million filing (many also don’t file unemployment). That would imply,
At least 40% of the labor force has been on unemployment at some point in 2020.
This can cause major civil unrest, reduced income can lead to reduced velocity of money (as people save), and cause a contraction of the economy. If the US (and other countries) continue the lock-down(s) through winter, it’s likely we could see tens of millions more unemployed.
Closing Thoughts
It’s time to get back to work. COVID-19 is deadly, as deadly as cancer or heart disease. Unfortunately, it’s also something that we aren’t going to be able to cure any time soon. No vaccine has proven effective to-date. Even if a vaccine was approved by the FDA and confirmed effective, the reality is that by the time it’s distributed (months) the pandemic will be starting to end.
The economy cannot wait that long. If we have additional lock-downs we will suffer a far harder decade. There will be more riots, more looting, more homeless, more death. Things are going to get much worse. White collar jobs are typically funded by the lower collar labor force spending money. As companies come to realize revenue will be down at least another 8 to 12 months, they’ll have to cut workers — making the issue worse. This has all the markers of a depression.
COVID-19 will be the least of our problems if a depression hits, especially with a prediction of only 0.15-0.25% of the population dying from COVID-19. If the predictions are accurate, it’s likely many people won’t even know anyone who dies from COVID-19. On the other hand, almost all of us already know people who lost their job. It is entirely possible that fatality rate could spike to 1-2%, if hospital capacity fills up. At which point, yes, it might be worth imposing light restrictions. However, the reality is that without businesses, food is soon going to be a problem.