
Today, it is fairly common to turn on the news, read a book, listen to a lecture in history and for the speaker to discuss the cost of a war. Quantifying the cost is usually done in dollars, assessed by how much money was actually spent or how many lives were lost. The victor and loser of a war usually quantify the gains in terms of territory gained, enemies killed, or wealth captured.
However, is this really the right way to quantify the cost of war? For example, the total number of individuals killed in the U.S. Civil War was ~650,000 souls on the battle field, 7 million in total, or about 2.5% of the U.S. population at the time[1]. This number seems monstrous to us even one hundred and fifty years later. Now if we look at World War II, some 80 years after the U.S. Civil War, it is estimated that some 20 million military personnel were killed, as well as 40 million civilians[2]. These numbers seem even more unfathomable, yet which war was really more costly?
Introduction
The cost of war is often counted as loss of lives, cost in dollars, or territory lost; this seems like a rather static comparison. For example, $1 million two hundred years ago does not equate to $1 million today. Similarly, 1 million battlefield deaths in a world of six, seven, even eight billion people does not equate to when the world consisted of one billion people.
Rather than comparing static numbers, it should be calculated by potential product/wealth lost over time. In other words, compare the opportunity cost of war, as opposed to the actual lost. For every life lost in a war, the country loses that individual’s future production, their future children’s production, their future grandchildren’s production, etc. Essentially, a single life is worth not only his or her’s current potential production, but also their children’s future production. Therefore, making every life worth exponentially more over time.
Similarly, investment of wealth would also grow at a similar rate, as every dollar invested produces more money to invest. However, this is a discussion for another time. On the other hand, the loss of territory and infrastructure do not grow at an exponential rate. The territory has a fixed number of resources and the infrastructure (once rebuilt) is constant.
Off this premise, a more comprehensive cost of war can be drawn.
Method
Using the average number of births, fertility, deaths per year, and GDP (gross domestic product) per capita per year, it becomes possible to generate the approximate cost of each war. Including the loss of territory, infrastructure, and wealth as the GDP of a country takes into consideration the loss of territory, infrastructure, machines.
In the article below, I do not differentiate between countries, but rather use an average from countries with records of GDP in the past (1820 – 2007), most notably the Scandinavian countries (Denmark, Norway, Sweden, Finland).
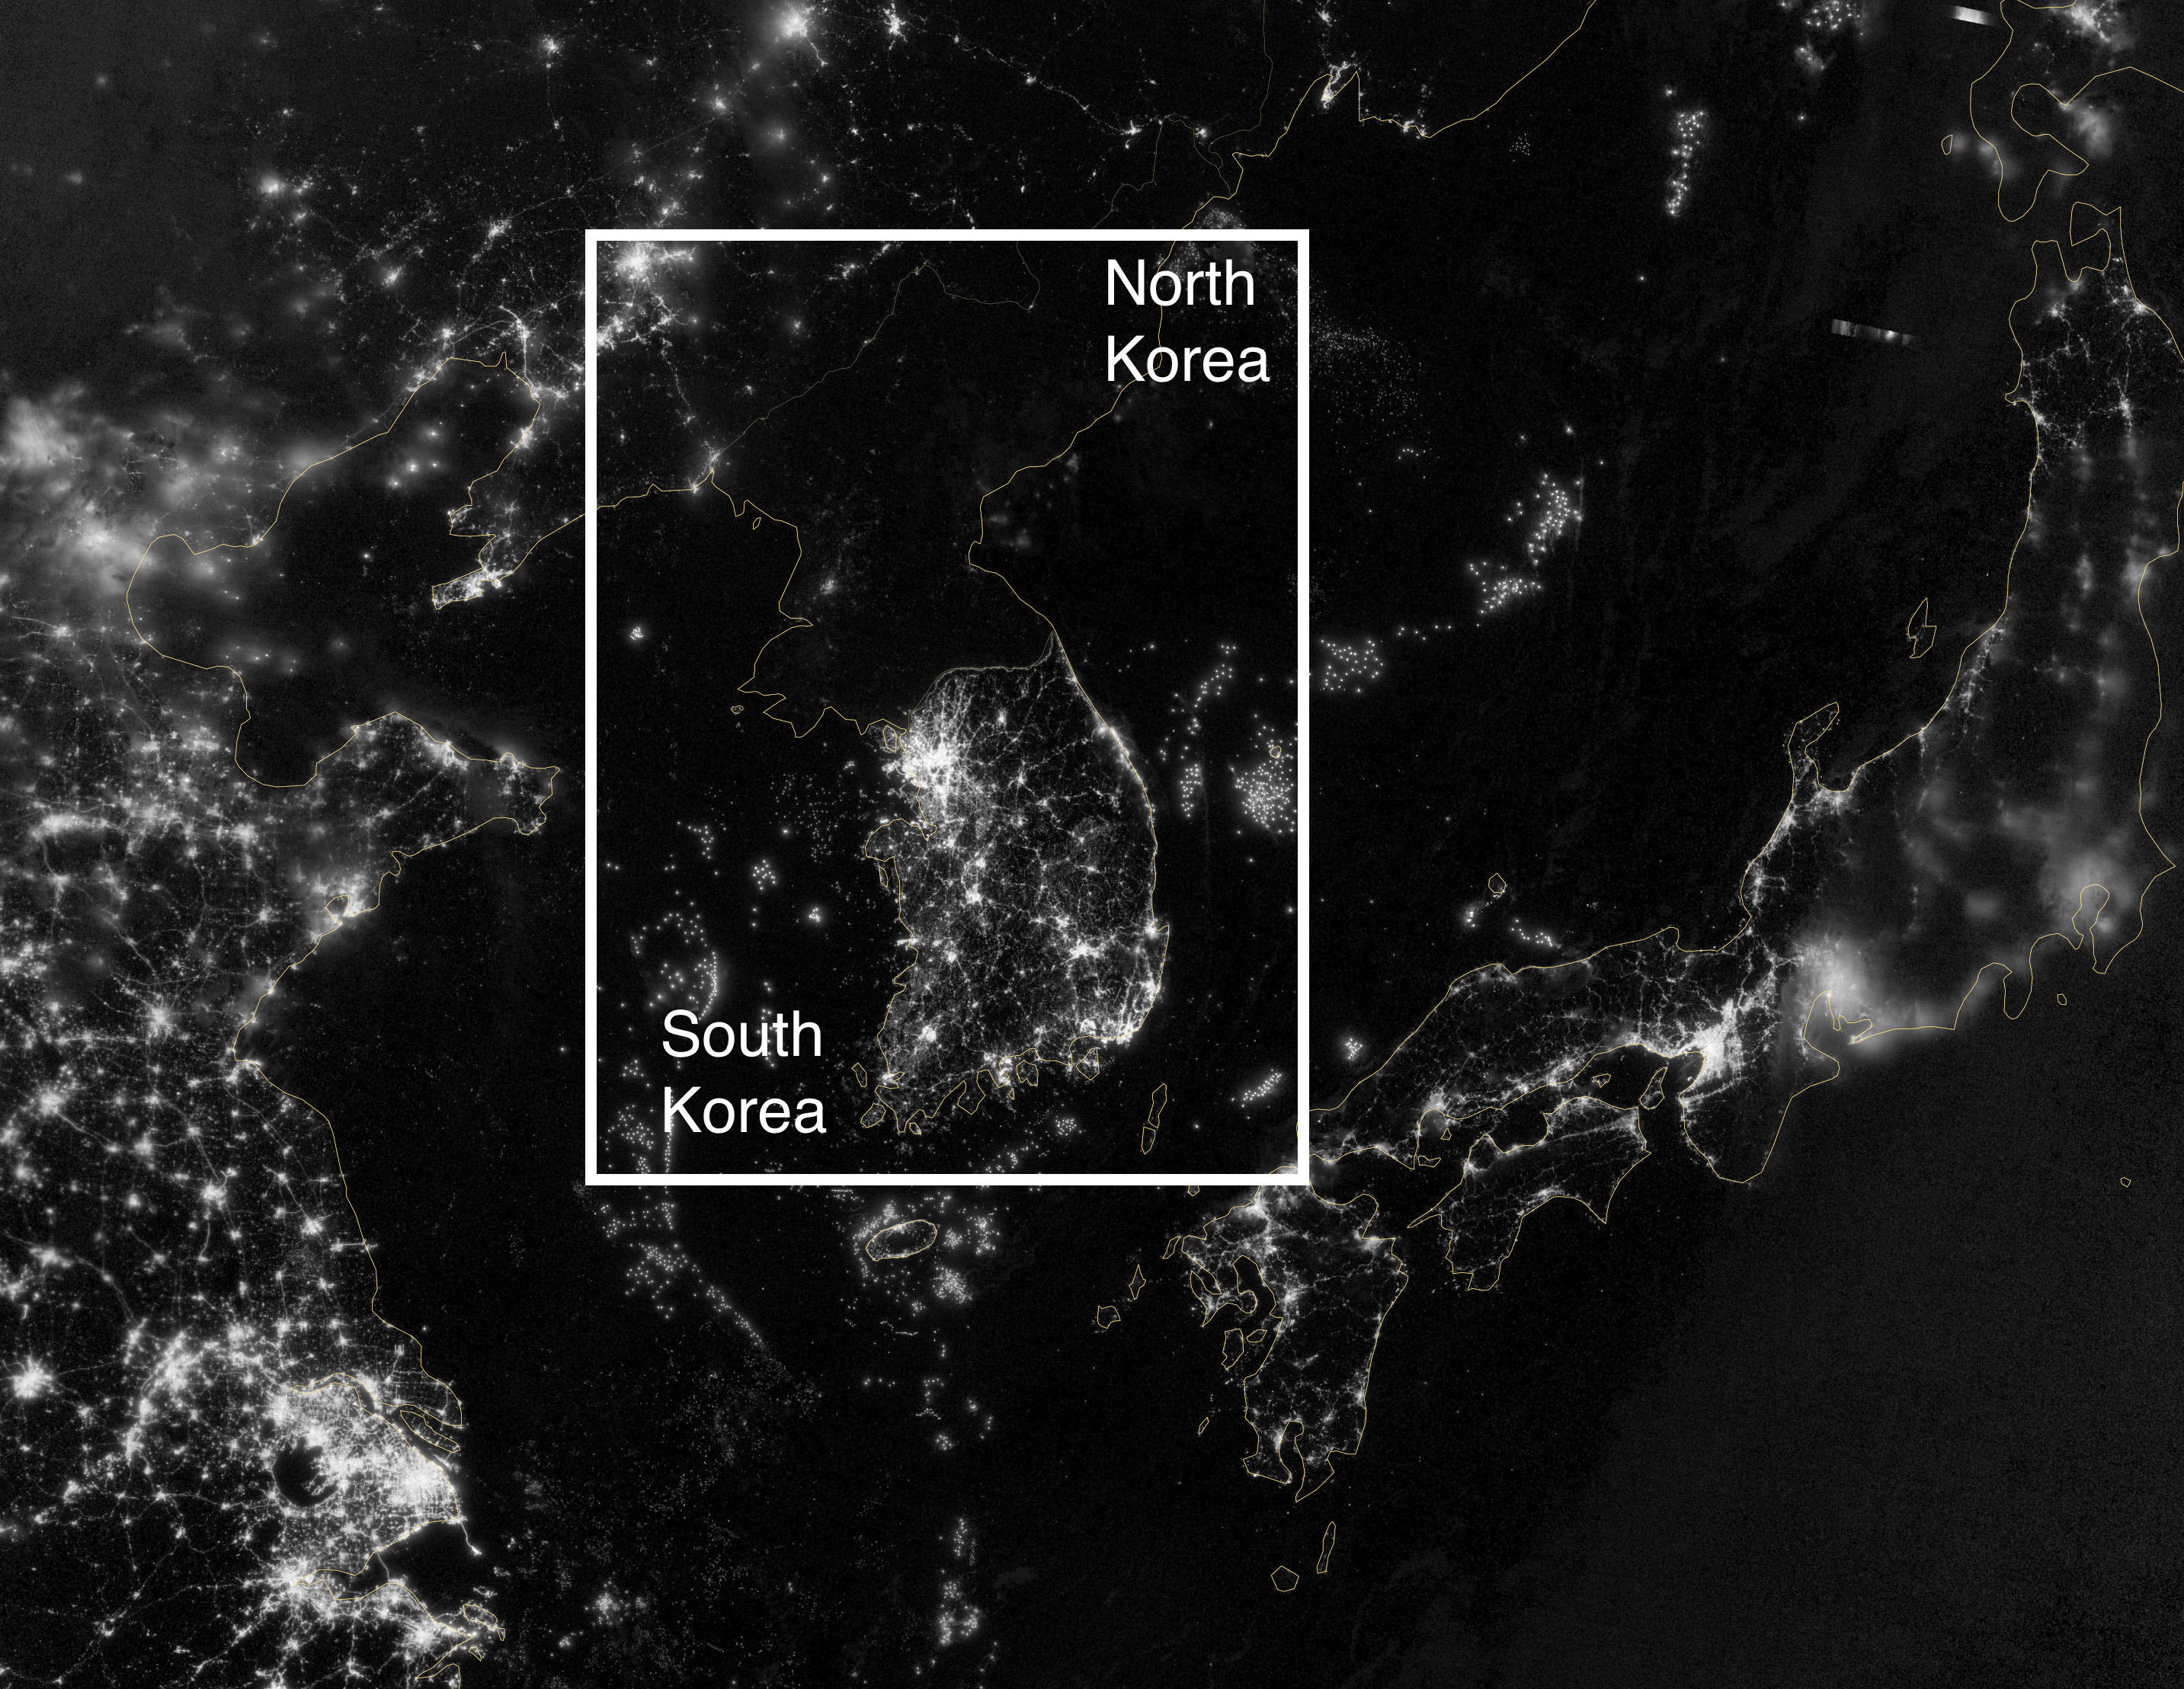
Below, it is possible to see images of Berlin and Korea, two places where GDP per capita were significantly different for a prolonged period of time (due to a war). The dimmer lights representing less use of electricity and in turn less infrastructure, technology and wealth. The images help to depict the dramatic effect a prolonged war can have on GDP per capita, and in turn, the actual cost of the war.
Berlin, Germany (today)

Korea (today)
GDP per Capita Over Time
It is interesting how few estimates there are regarding the GDP per capita over time. The two most reliable sources, or at least the clearest sources, were a paper by Bradford De Long[1] from UC Berkeley, and a collection of data sets from worldeconomics.com titled Maddison Historical GDP Data[6]. It is possible to view the data sets on my github or in my Google Drive. The below graph depicts the world GDP per capita over time:
 Notice, from 0 A.D. to about 1800 A.D. the estimated GDP per capita was roughly constant, this is likely due to the lack of machinery/technology, and most of the GDP was created by animals/humans. If we then zoom in from 1850 – 2010 we can see the dramatic increase in GDP per capita:

Notice, each of the little dips in the average world GDP per capita is associated with a war of some kind, U.S. Civil War, World War I, World War II, etc. To get a better picture of this, it is possible to view several of the highest GDP per capita countries.
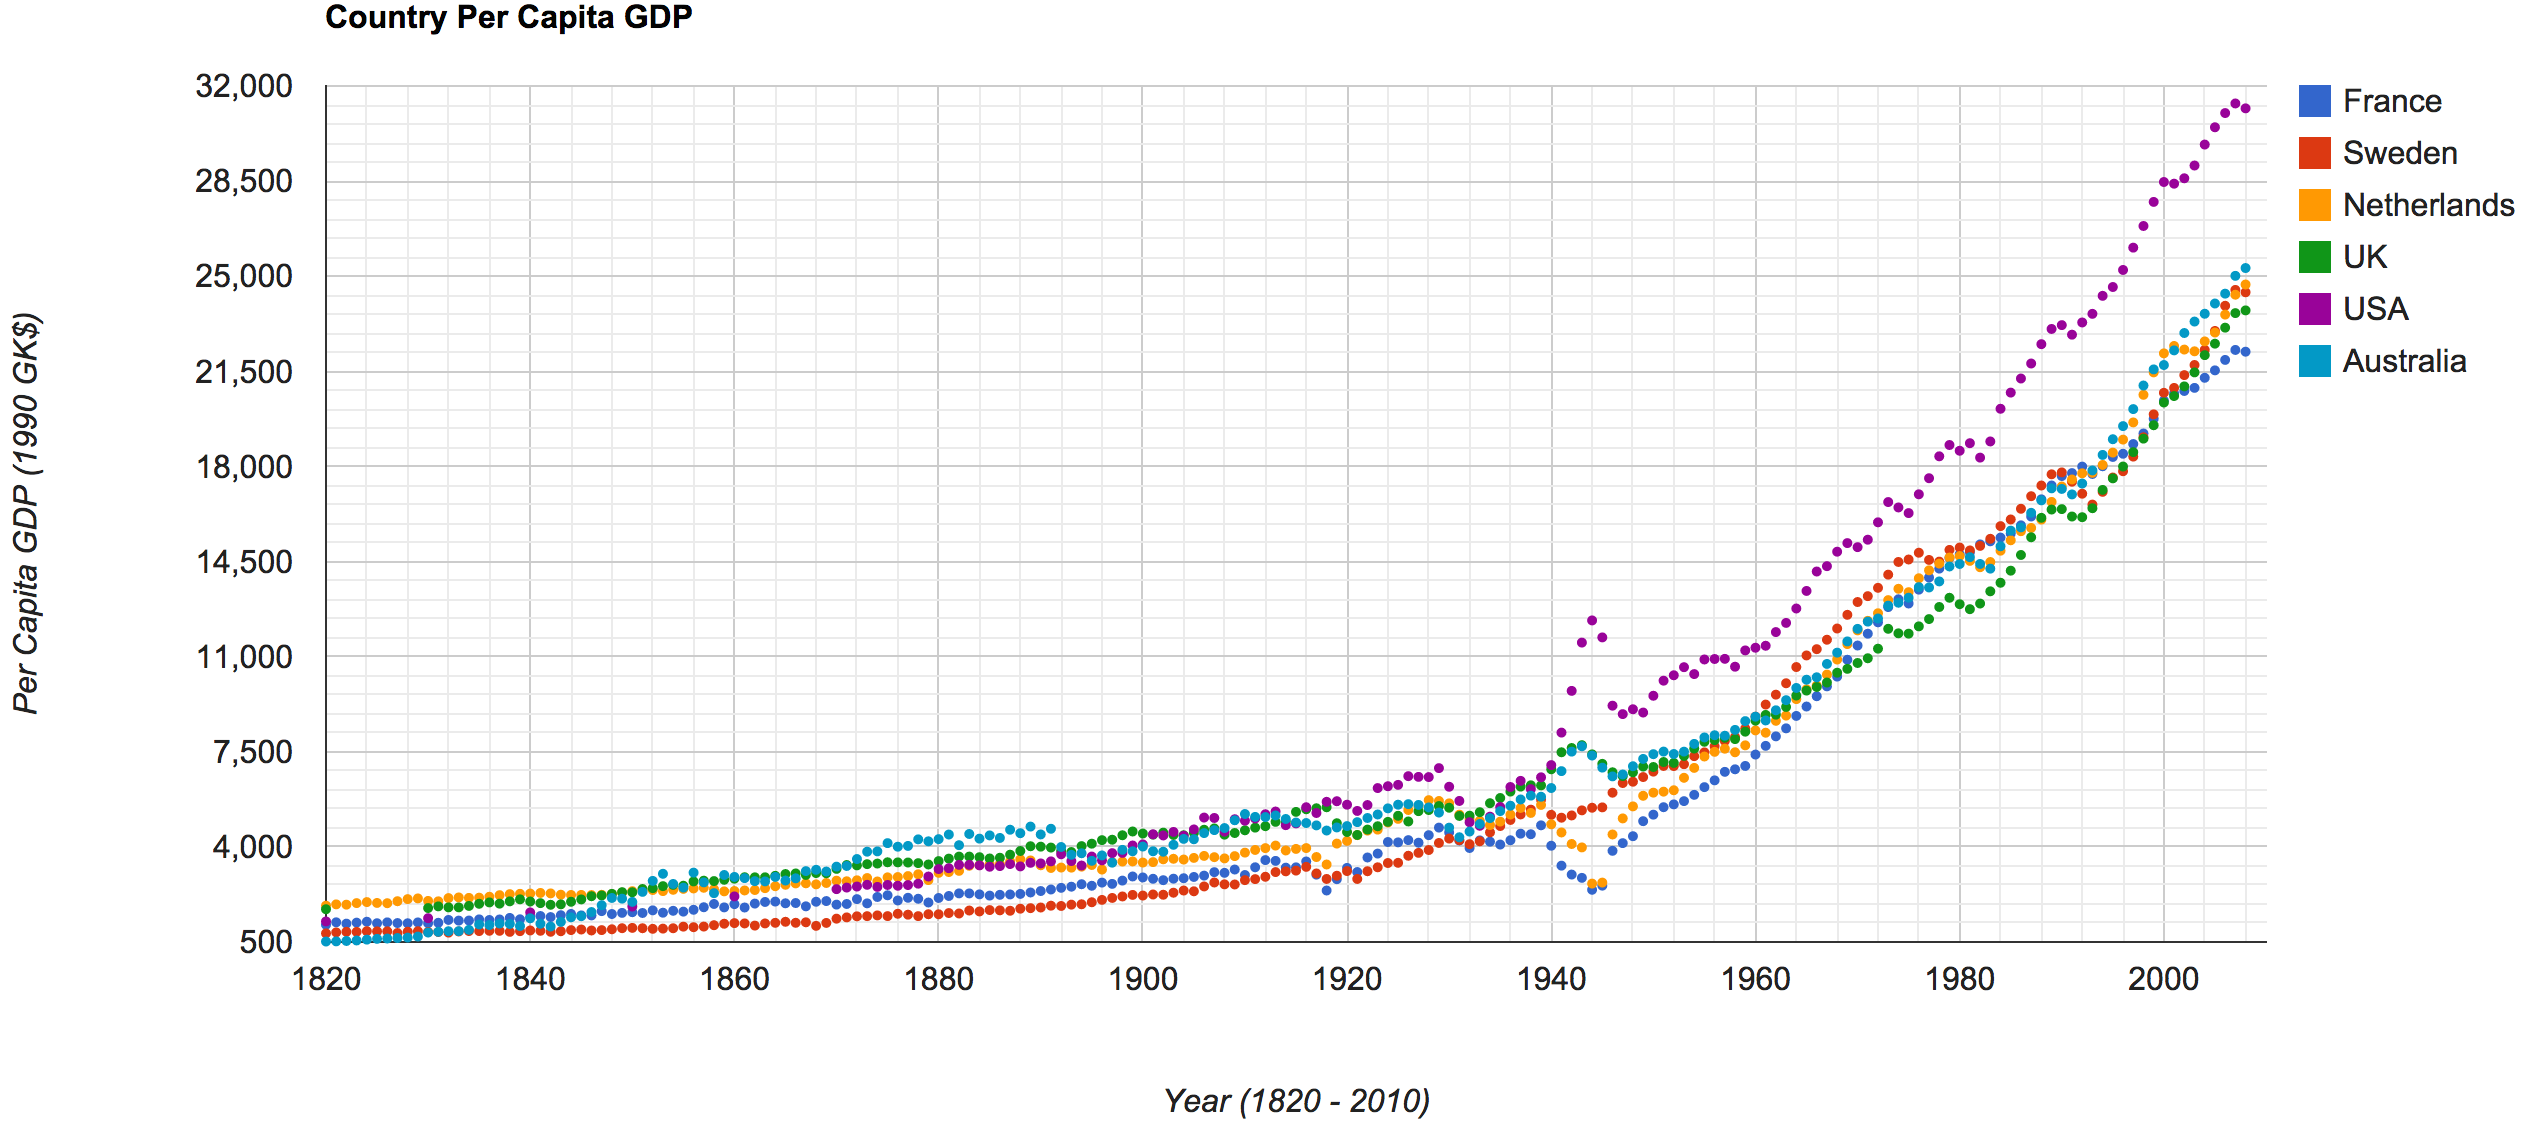 I found it interesting that during World War II, there seemed to be a dramatic GDP per capita increase in some of the countries fighting the war that were not occupied (USA, UK, Australia), no increase in the countries that did not (Sweden), and a dramatic decrease in occupied countries (France and Netherlands).
The purpose of this was to show the dramatic increase in GDP per capita over the past couple hundred years, as well as the fact that GDP per capita relates rather closely with the overall production capacity of the country. Moreover, the GDP per capita has increased far more in the last forty years or so than previously. Each region has grown at a significantly different rate:
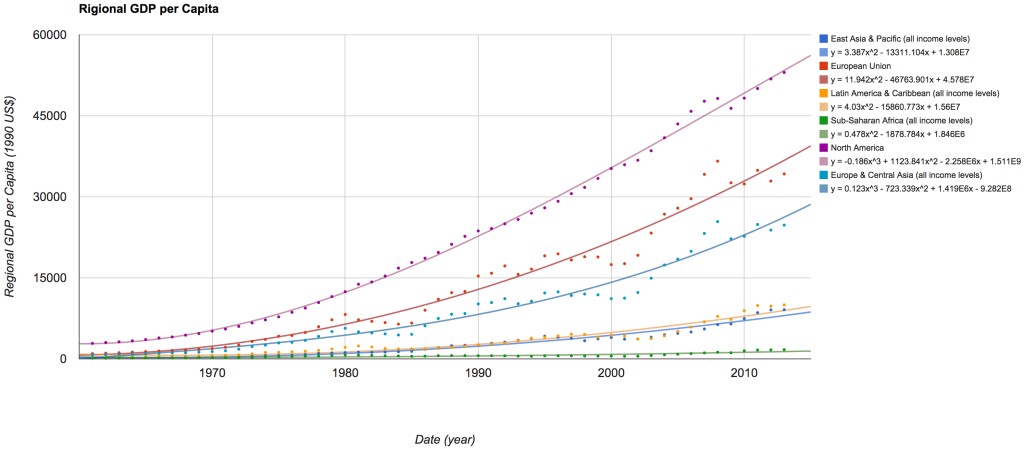 This seems obvious after some consideration, the reason the GDP per capita increased greatly over the past couple hundred years was due to machines/technology magnifying workers ability. Thus, each worker produces more and it can be said that (likely) the higher the GDP per capita, the better the infrastructure and technology of the associated country.
The data will be used to calculate the potential GDP lost per soldier lost on the battlefield.
Children per Woman
Over the past century, there has been a steady decrease in both infant mortality rate (meaning more children survive), as well as a decrease in birth rates[4]. If we use these values to find the average child per woman, we can obtain a nice graph, which depicts the steady decline in the average number of children per woman (in their lifetime). The graph below was generated using the same country data as the average GDP per capita.
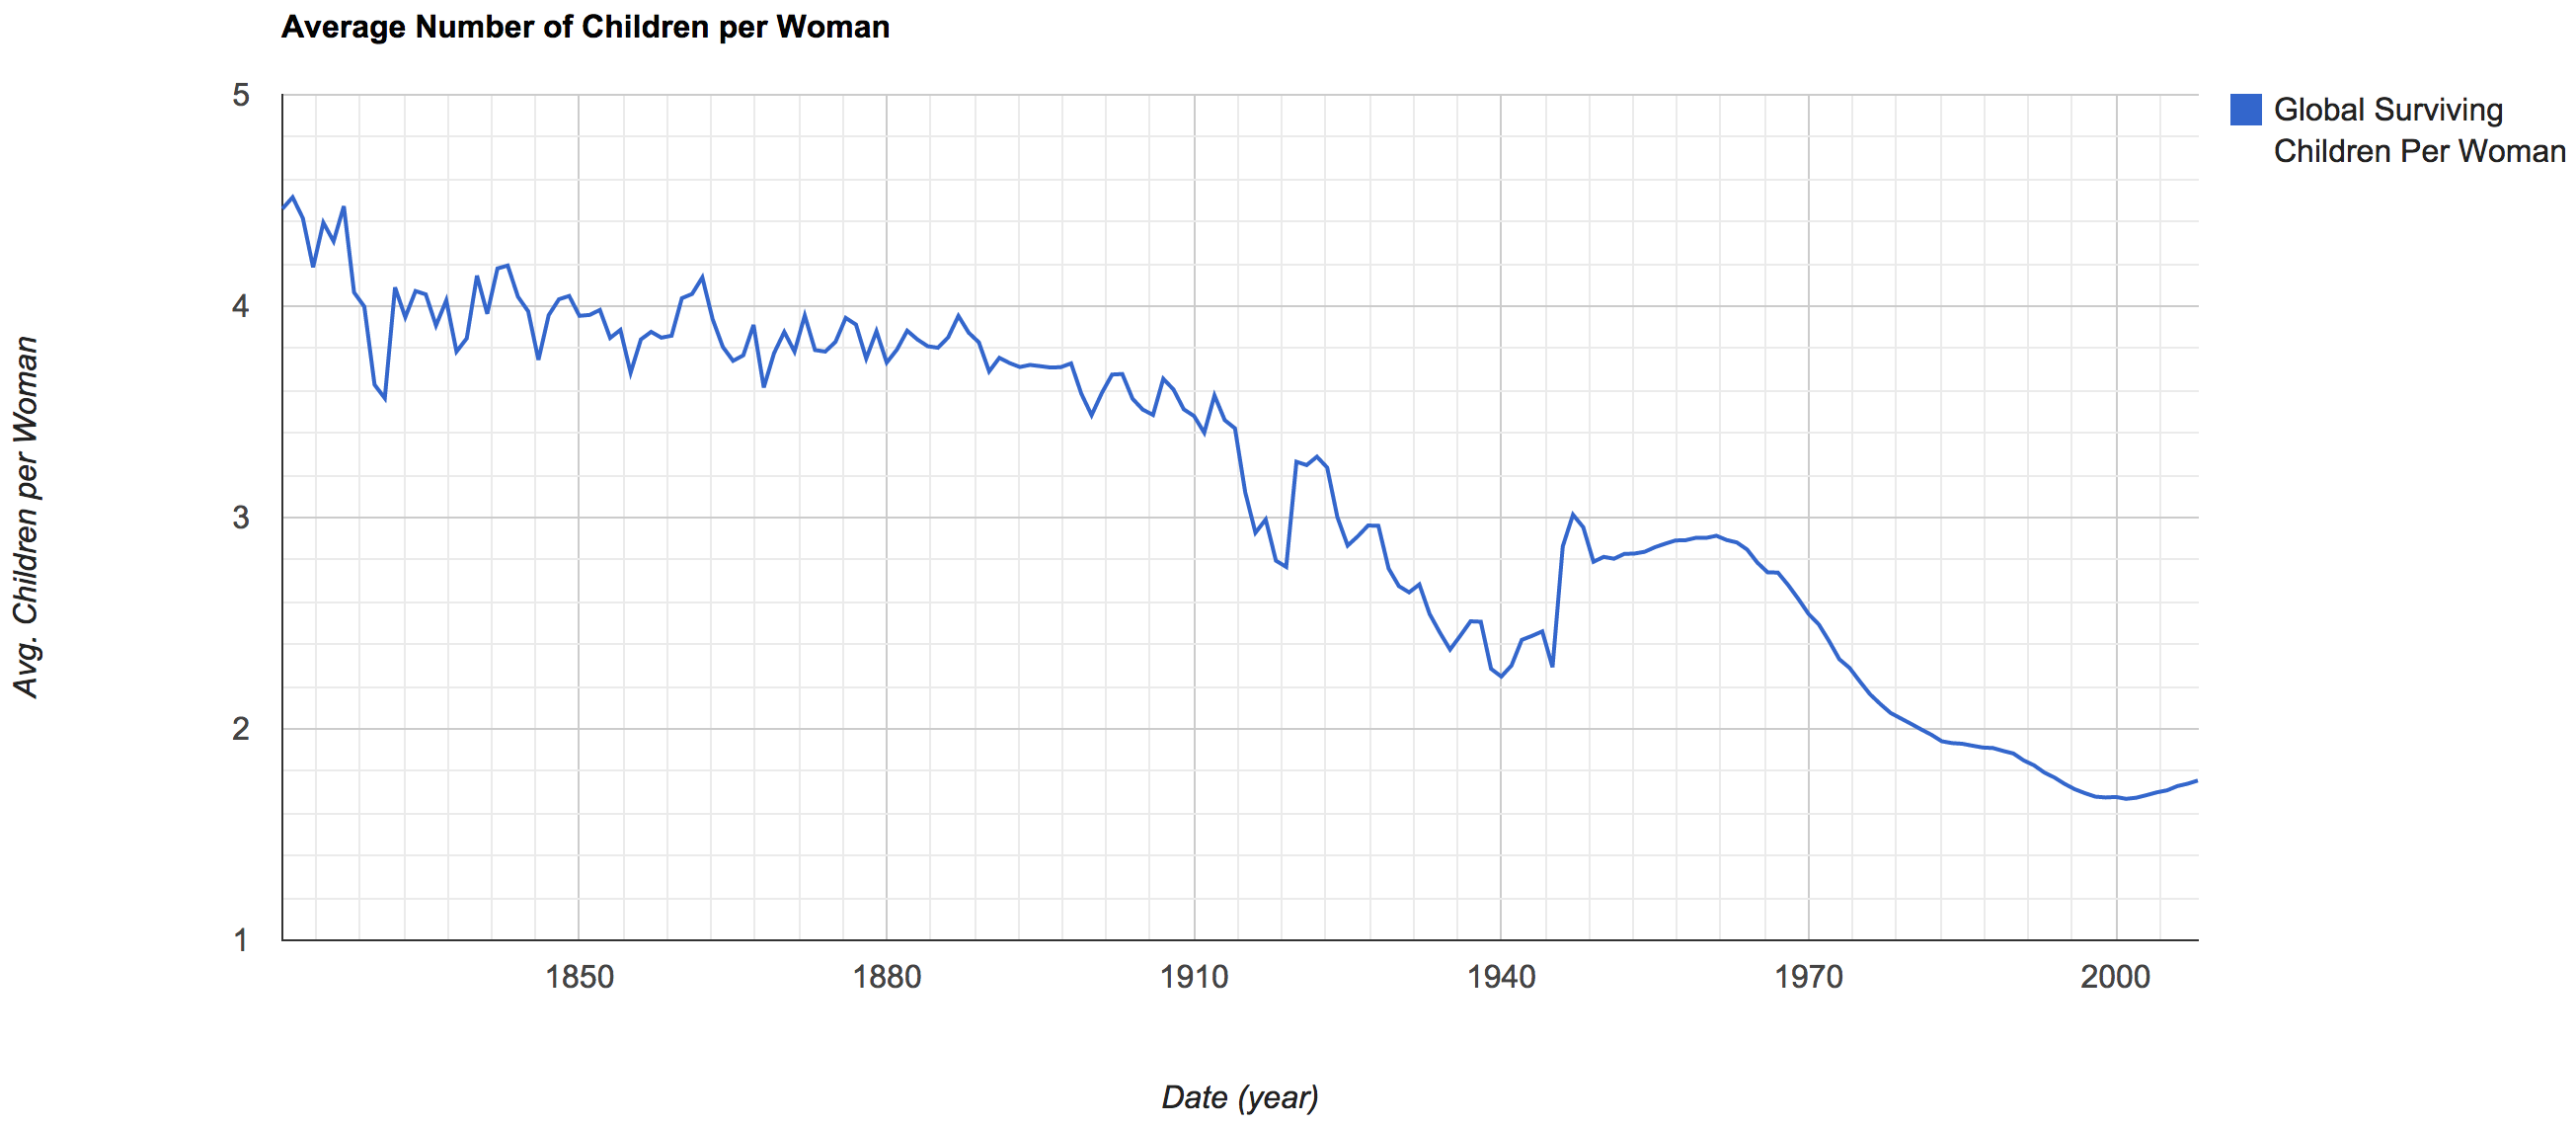 We then can use this data to determine the number of children born to each potential soldier for each generation. The data will used in the process of normalizing the number of battlefield deaths.
Normalizing Battlefield Deaths
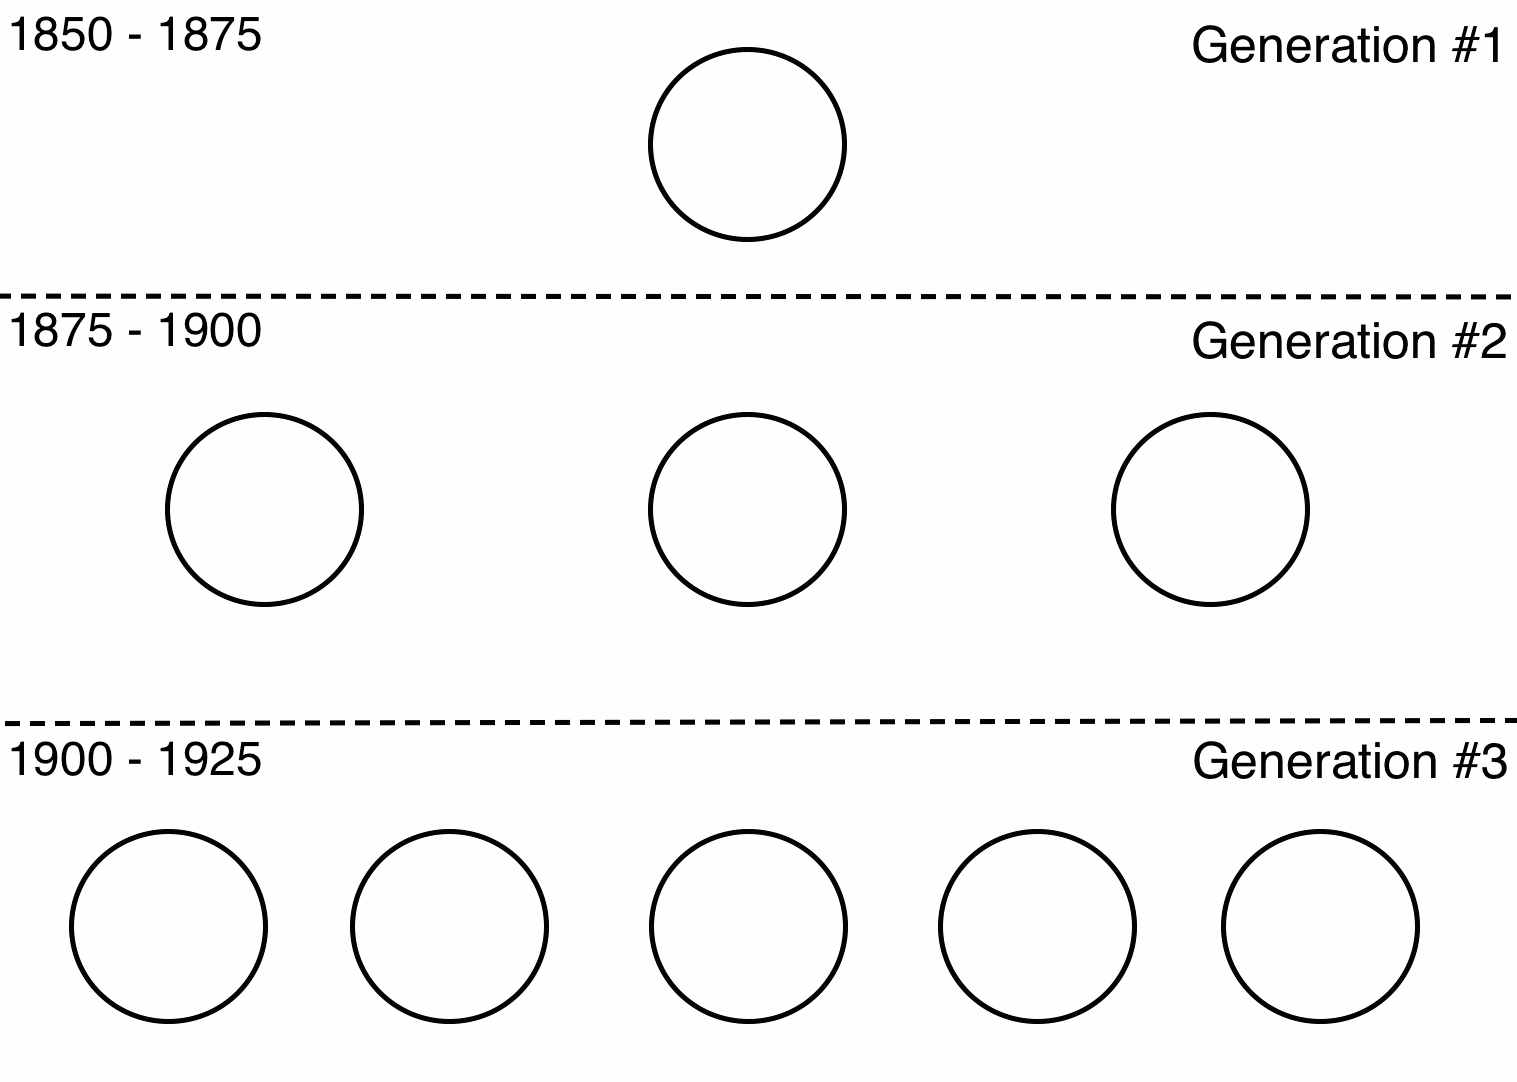
In order to normalize the battlefield deaths, i.e. take the number of deaths in a given year and compare them to the current population, I take the average number of children and multiply that for each generation of the fallen soldier. Thereby adjusting the death counts to be equivalent to the current time period, below is a visual representation:
 If we were to write this in a mathematical form, we take the product of each generation. The formula assumes we are given a start year for the generation, and the total battlefield deaths for the given year.
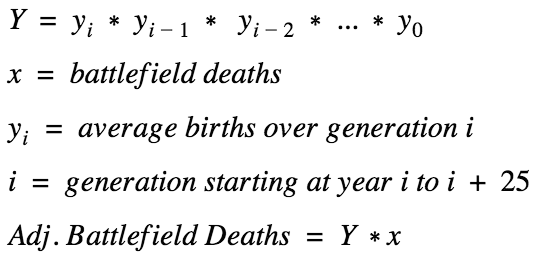
In essence, each generational loss is a product of the previous generational loss. As such, each generational loss is multiplied by the previous generational loss until the original generational loss (where y0 = 1), then we multiply by x, which is the number of battlefield deaths.
If we were to program this, we would get something such as the following (also viewable on my github):
'''
  Outputs the lost population due to war
'''
def popLostInYear(year, deaths, fertility):
    genLength = 25
    lostBirths = deaths
    if (year + 25) < 2007:
        births = 0.0
        for i in range(0, genLength):
            births += (float(deaths) * fertility[year+i])
        lostBirths = int(births / 25.0)
        year += genLength
        return lostBirths + popLost(year, deaths, fertility)
    return lostBirths
Below are the graphed unadjusted battlefield death counts per year. The counts per year are based on the start year of the war, i.e. the U.S. Civil War 1861 – 1865 is only represented in the year 1861, because that was the start year of the war.
 Around 1861 it is possible to see a rather large number of deaths, and during World War I and World War II a massive number of deaths. However, if we normalize (to 2007 population counts) the deaths by determining the number of battlefield deaths multiplied by each generation of children lost, we get the adjusted battlefield deaths (as shown below).
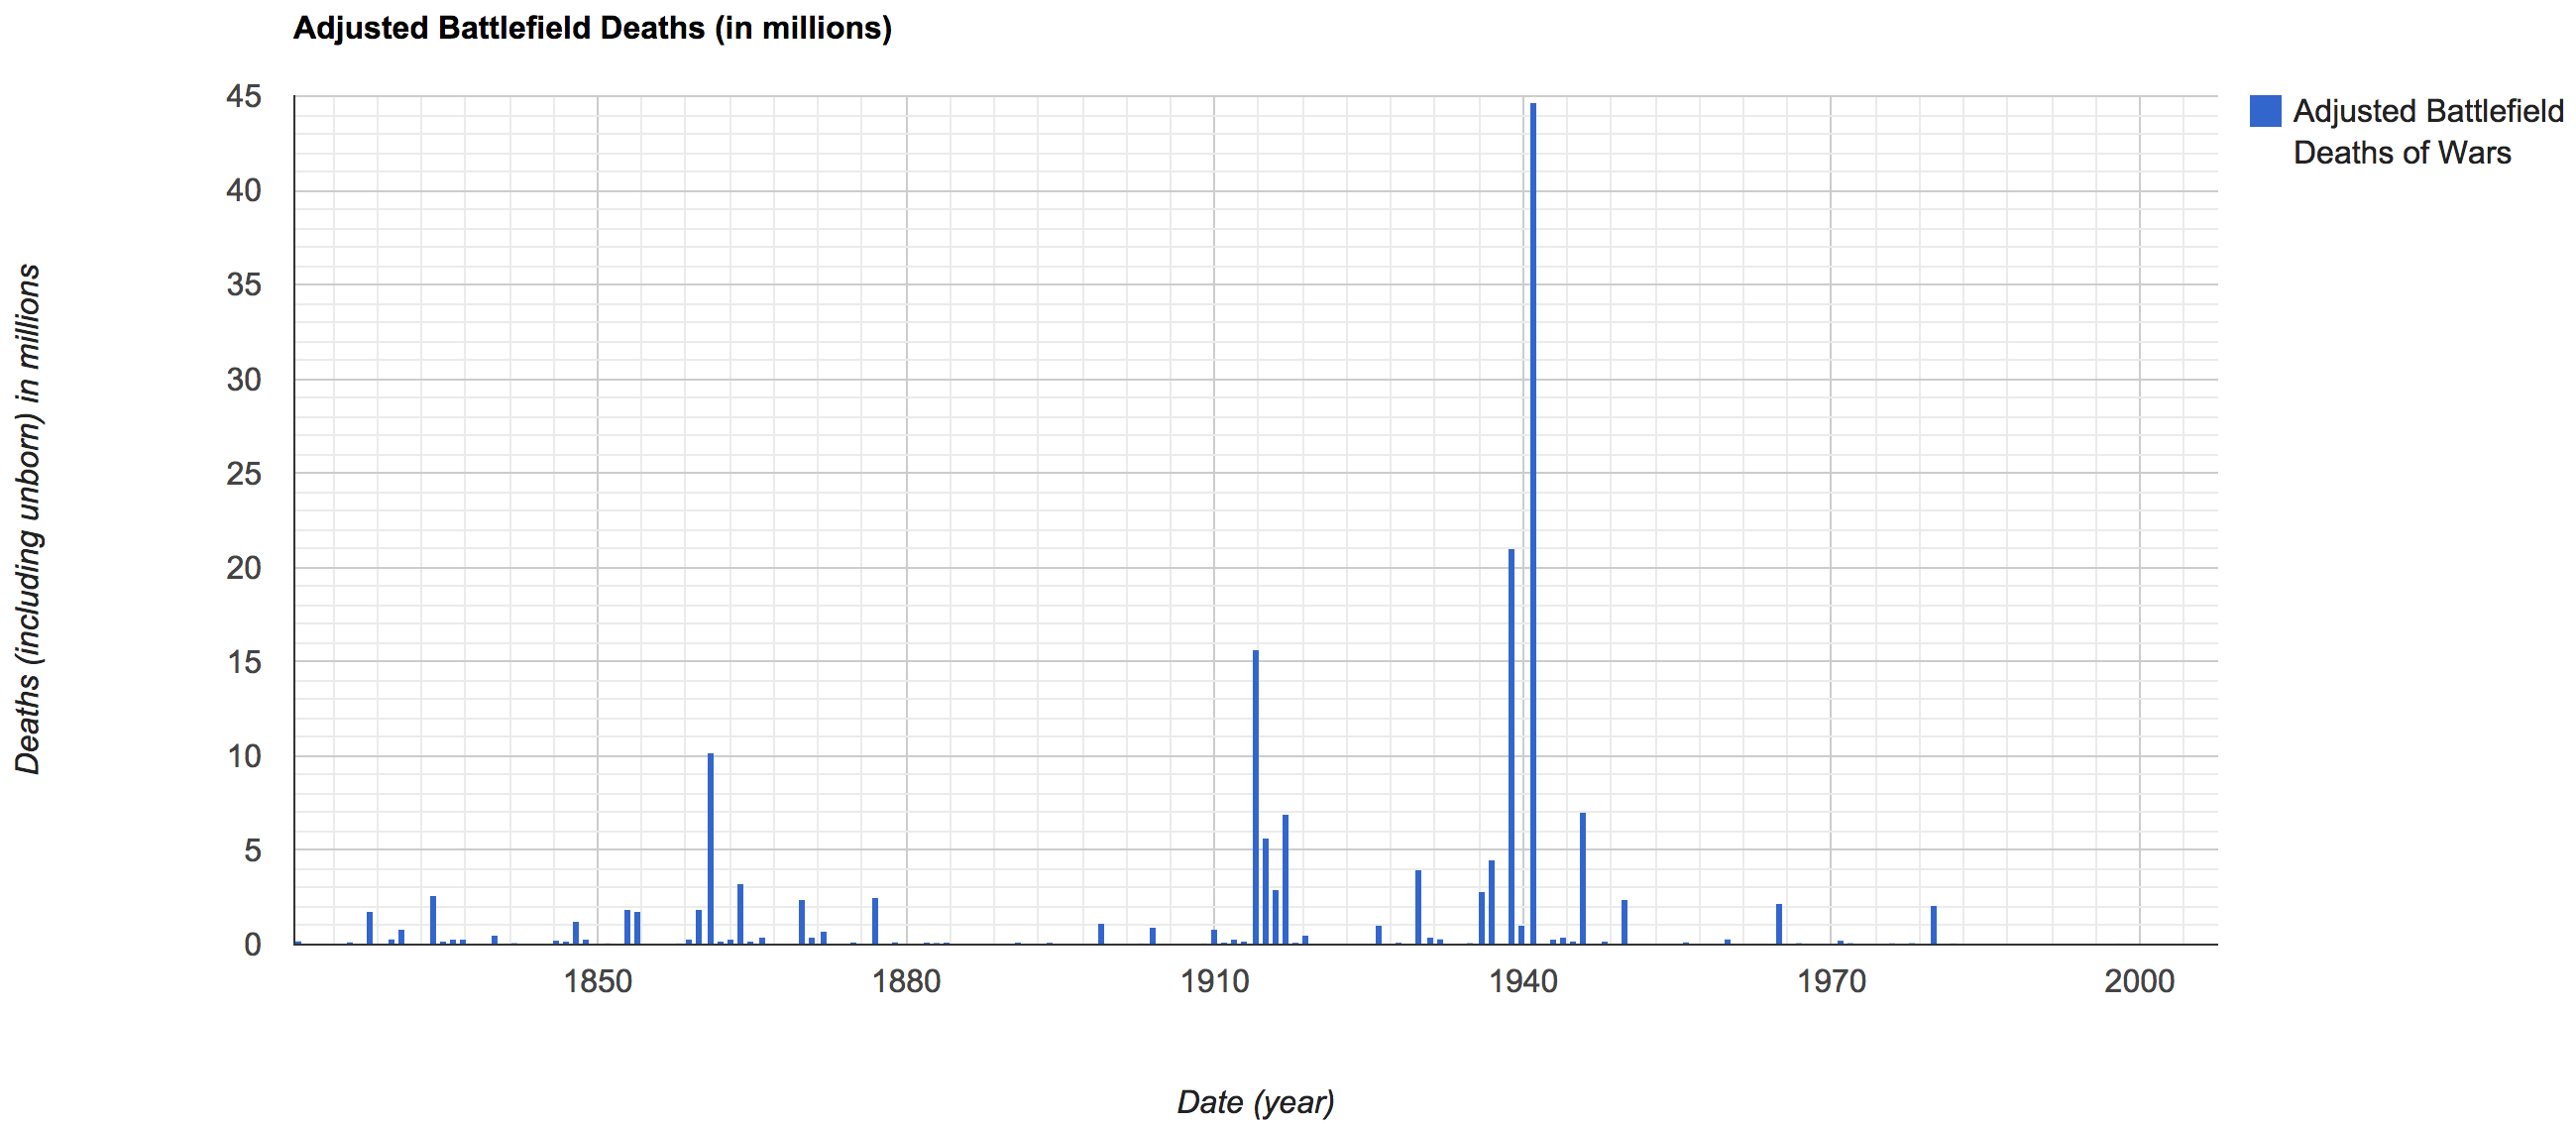 Reviewing the adjusted battlefield deaths, the first thing that stands out is the peak year of battlefield deaths, 1940 (World War II) has gone from ~7.5 million deaths to an adjusted ~44.5 million deaths. The next, and more interesting point, is that the earlier wars have grown significantly from thousands to millions of losses. Further, in comparison to World War II and World War I the U.S. Civil War as well as other previous wars have grown significantly.
It should be argued that it is possible to normalize the number of battlefield deaths by reviewing the total population at the time and comparing it to the current population. For example, the 650,000 soldiers who died in the U.S. Civil War can be adjusted by taking ~7 billion world population in 2012 and dividing it by the ~1 billion world population in 1860. More formally, 650,000 * (7 / 1) which equates to an adjusted 4.55 million battlefield deaths, as opposed to the adjusted ~10 million battlefield deaths via the current method.
Unfortunately, this method is convoluted by many events throughout history, including multiple wars; thus, reducing the integrity of the method. Hence, the chosen method seemed to provide a more accurate adjustment for battlefield deaths.
The Opportunity Cost of War
In order to calculate the true cost of war over time, we must first calculate what I am going to refer to as “lost generations,” or what has previously been described as adjusted battlefield losses, must be accounted. Then each member of the “lost generations” lost production towards the total GDP. Laid out in a more logical fashion, the method makes use of the following:
- Definition: The “lost generations” refers to the potential unborn offspring of the dead soldiers
- Postulate: Each battlefield death and subsequent lost generation is an opportunity cost of war (i.e. GDP forgone)
- Assumption: The average battlefield death is 22 years old
- Assumption: Each individual in a generation can work 25 years and can produce the average GDP per capita
- Calculation: Offspring = the avg. fertility (birth rate) over the 25 years * current generation count
- Calculation: Generation GDP production = sum of 25 years avg. GDP per capita * current generation count
Finally, the summation of all of the GDP produced by the “lost generations” is the total opportunity cost of the war. Obviously, this method is not perfect. However, it does shed light on the actual opportunity cost of each war.
Below you will find the total lost GDP for each war (all of the GDP has been adjusted to 1990 US $), notice the shift in the cost of war.
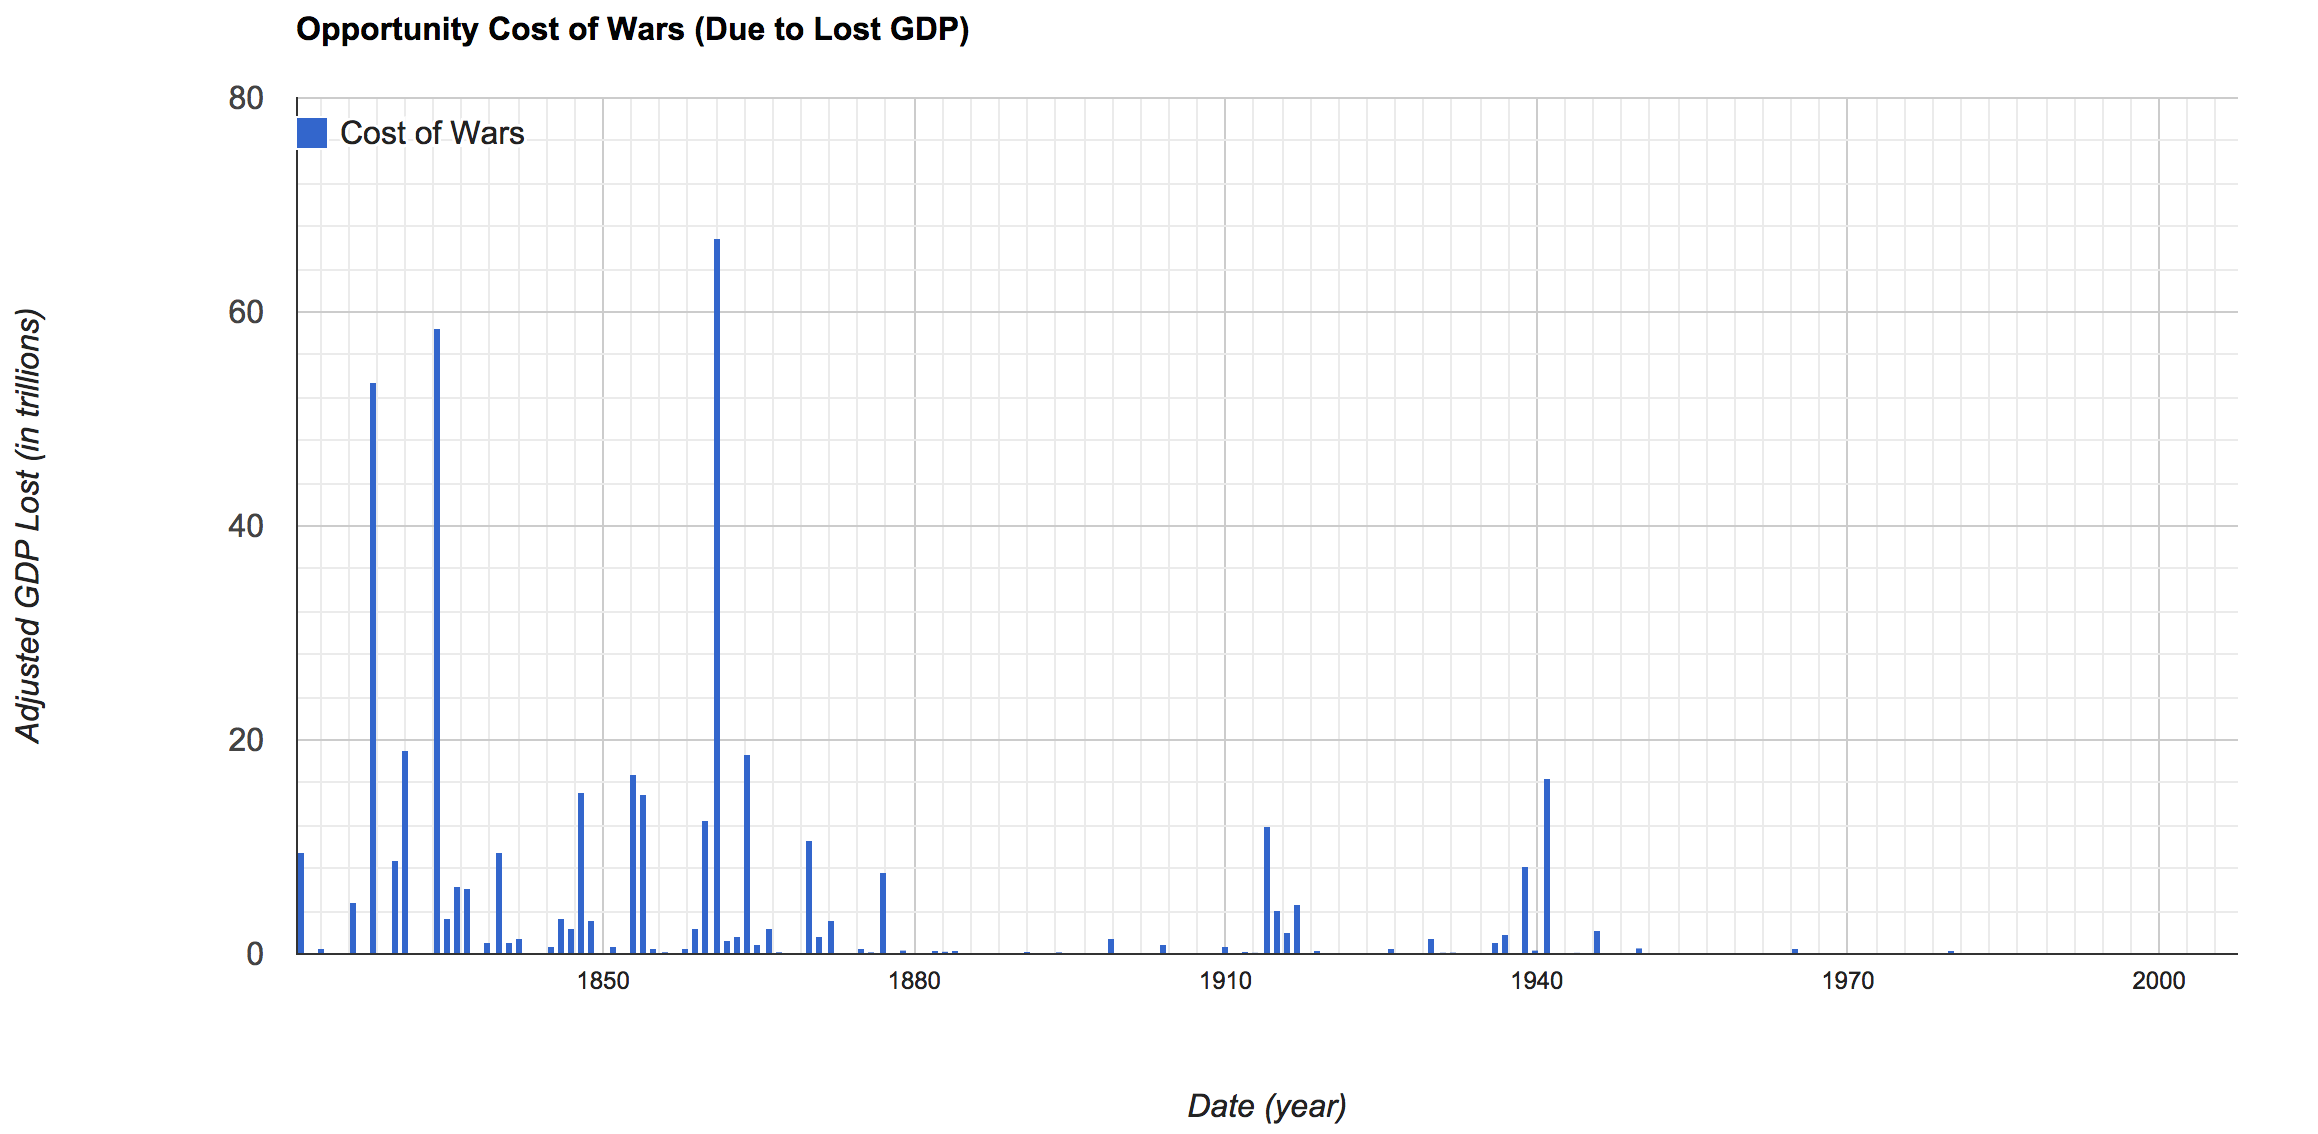 The shift of cost to the wars to the left is due to the fact that each loss of GDP due to the “lost generations” grows over time. Thereby making the oldest wars cost significantly more than say, World War II, because the growth of the overall loss of generations becomes so great.
I took the liberty of labeling some of the more costly wars throughout history,
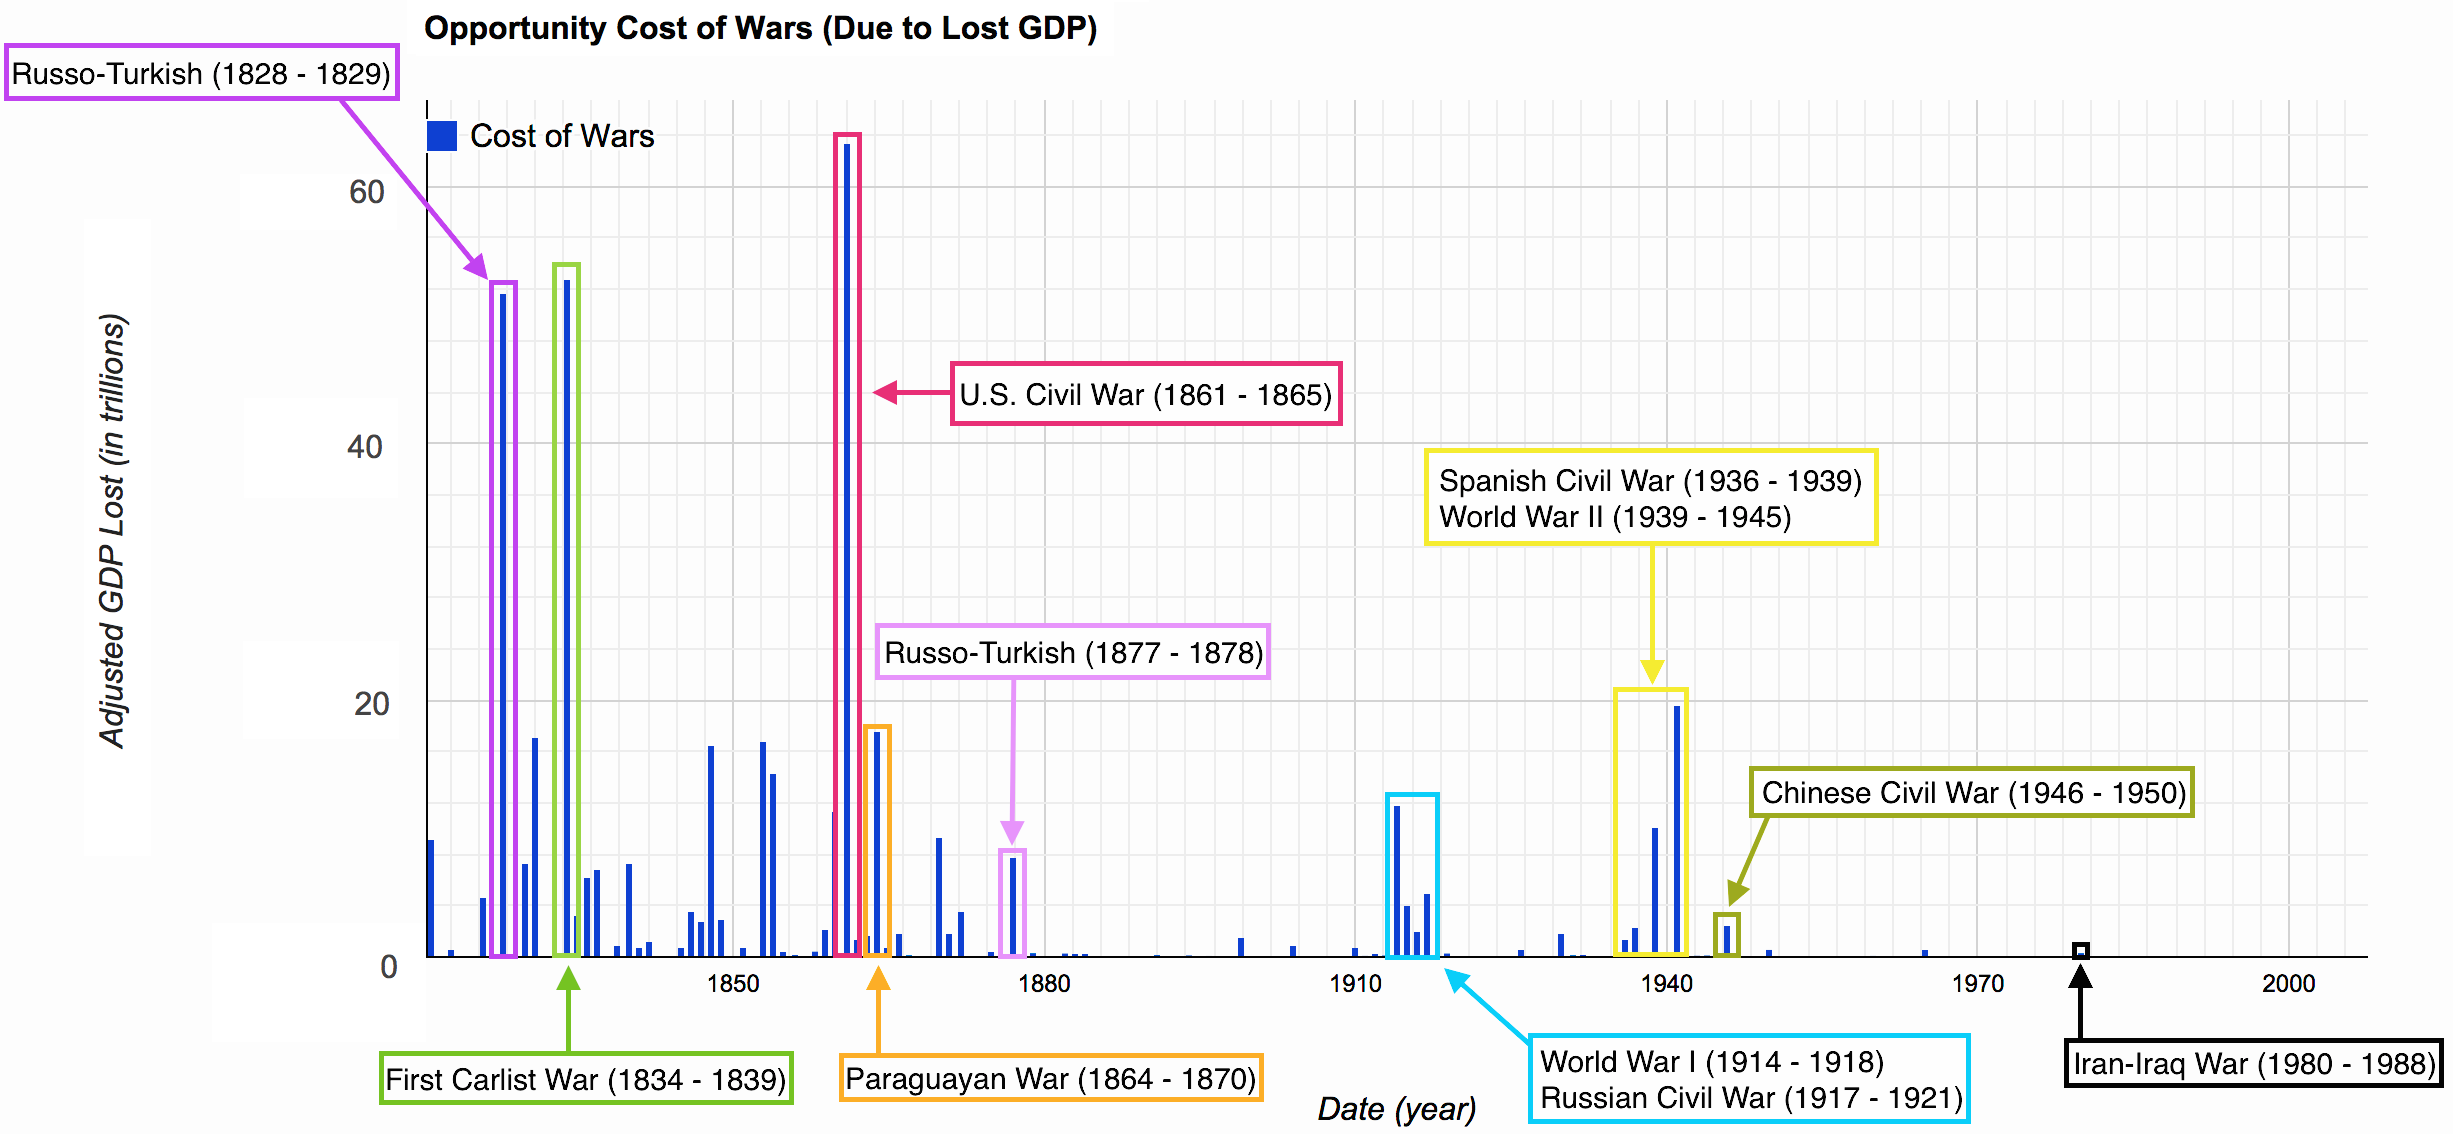
The most expensive war from 1821 – 2007 ends up being the U.S. Civil War, followed closely by the First Carlist War (1833 – 1839), and the Russo-Turkish War (1828 – 1829). Considering nearly 2.5% of the United States population at the time was killed in the U.S. Civil War the graph makes a fair amount more sense.
On the other hand, it does seem strange that the “deadliest” war in history (World War II) is not higher up the list of most costly wars. Though when considering the fact the U.S. Civil War happened 80 years prior, or three generations previous, there are three generations of lost GDP production.
It is also important to recall that this method of determining war cost only accounts for the lost GDP due to battlefield fatalities, not for the total destruction due to the war (or civilians killed).
Conclusion
After adding up the cost of each year of war over time totals to $437.62 trillion in 1990 U.S. dollars. This figure only considers the opportunity cost using the method above; however, it is still astronomical. To put this into perspective, the total cost of the Apollo program was approximately $65.5 billion in 1990 U.S. dollars.
Making the opportunity cost of wars from 1821 to 2007, 6681.22 Apollo programs:
6681.22 = ($437.62 x 10^12) / ($65.5 x 10^9)
Imagine the difference in the world if just a fraction of those wars did not occur.
Alternatively, was any war truly worth it? Previously, I discussed that territory and industry do not cause the exponential opportunity cost, as they do not grow and are static. That being said, a war only seems to ever be worth it if the population gained by the victor outweighs the losses, and that population gain can be maintained over (quite literally) centuries. By increasing the countries population and maintaining the increase, the full returns of the exponential GDP growth can be gained.
Unfortunately, it seems relatively rare that a country maintains their gains through a war, and as such a war is almost never worth the economic opportunity cost. Hopefully, this method can play a role in whether a country going to war will “gain” anything.
Stay tuned for updates from Synaptitude (hopefully launching a kickstarter soon)!
References
- The processed dataset
- Code on my github
- Full Dataset in Google Drive
[1] Estimates of World GDP, One Million B.C. by J. Bradford De Long
[2] War data from Correlates of War
[3] Live Birth Rates by Year (infoplease.com originally from HHS.gov)
[4] Children per woman (total fertility) (gapminder.org)
[4] Infant Mortality Rate (gapminder.org)
[5] Deaths per 1000 live births (CDC)
[6] Maddison Historical GDP Data (worldeconomics.com)
If you want to take this idea to its logical conclusion, check out this paper.
I entirely agree, I figured I would let people derive their own conclusions.
I originally wanted to determine a more effective way of waging war, i.e. (perhaps) buying a countries major companies and destroying them or something. I just got caught up in the whole opportunity cost, and figured I would write a stand alone article later.
Would the reason for this be diminishing margin returns. It would seem the larger numbers of deaths in World War 2 have less of an impact due to the generated GDP per person having decreased.
On the flip side, almost every major technology we use today was initially developed by defense departments and wars served as catalysts for their production.